- Credits
- 0

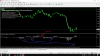
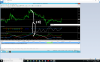
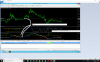
Hi mr tanaka this is a system that i bought in 2015 and untill now it is very profitable
The rules is when
FL24-Entry is buy
FL23-Exit is buy
TMA CG is buy (price reached to the blue line above or below
Filter FL-23 Exit period 17 is buy in H1 and H4 i also take the daily
Then open a buy at timeframe 15 min for all currency pairs
Exit when FL-23 change direction to sell in the 15 min time frame
It takes too much time for me to find signals for all currencies

Thanks for a great coffee.arrow appear or blue and red lines crossed
View attachment 88003
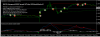



Hi many thanks attached a screenshot of the trades of todayHere you go.
View attachment 87986
Can you describe with some pictures?Hi mr tanaka this is a system that i bought in 2015 and untill now it is very profitable
The rules is when
FL24-Entry is buy
FL23-Exit is buy
TMA CG is buy (price reached to the blue line above or below
Filter FL-23 Exit period 17 is buy in H1 and H4 i also take the daily
Then open a buy at timeframe 15 min for all currency pairs
Exit when FL-23 change direction to sell in the 15 min time frame
It takes too much time for me to find signals for all currencies

Did you get good profit? My EA works on renko chart?Hi many thanks attached a screenshot of the trades of today
I started using it on my real account on Renko charts for GBPusd and EURUSD as ascalper just oppsite close yes profit 3 pips
View attachment 88007
I think I have already coded this EA,,, I forgot which one it was,,,, maybe you can read back.Hi Mr Tanaka,
Can you make an EA based on this Strategy?
Maybe this is complicated and I hope reteid2222 will help you.FX Galib Trading System:
- Chart Settings: Timeframe-H1, RSI Default Level 65-70 & 35-30, Moving Average Simple- 10
- Day Trading Time (According to ICMarkets): 7:00:00 - 18:00:00
- Candle touching SMA-line environment: Candle can touch with its tail / Candle can touch with its body. It has to touch the line & then retrace. Once the candle closes in one hour chart take the trade instantly.
Example of Buying:
Description: Search in RSI have touched 65-70 levels recently and have gone down a little bit, then crossed the SMA-10 line with a full bullish body is a buy trade. (Take Entry After Cross Bar in Closed in H1)
Image Example:
Example of Selling:
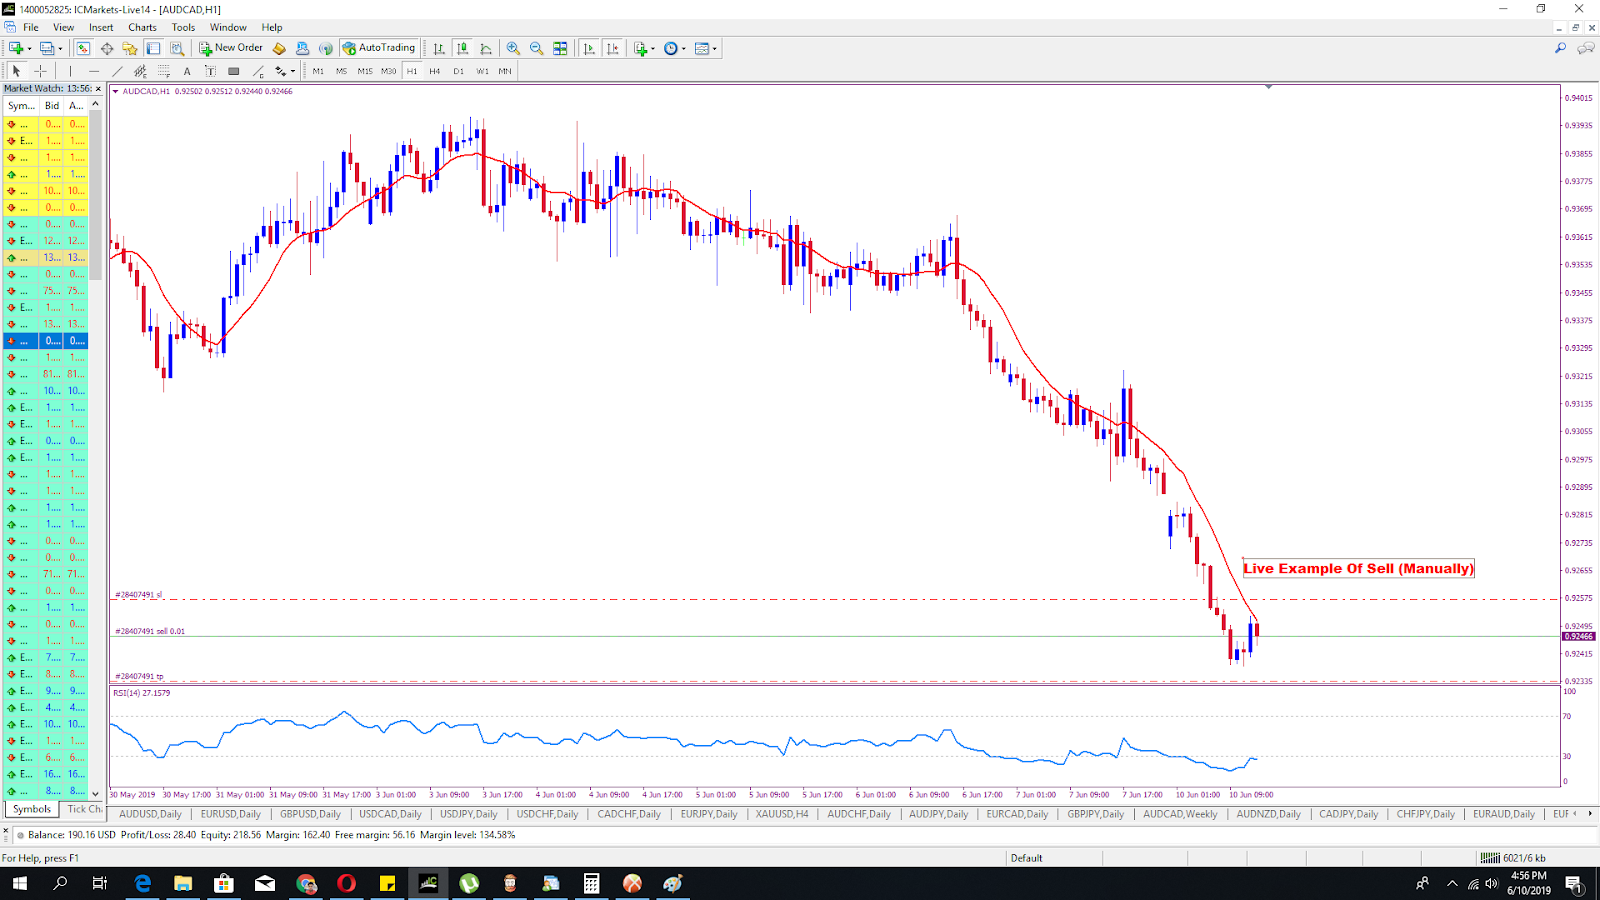
Description: Search in RSI have touched 35-30 levels recently and have gone up a little bit, then crossed the SMA-10 line with a full bearish body is a sell trade. (Take Entry After Cross Bar in Closed in H1)
Image Example:
Live Trade Example Results:
Note: No need extra large input panels just a simple input panel is fine and workable while you have to focus on entities on correct conditions only. TP/SL can be input via Input Panel. T/P & S/L can be changed manually by me and make sure ea don't edit back again while it's turned on!
The concept behind the strategy: When a market goes to RSI65-70/RSI30-35 it means the market had got a trend and it may go more and more while showing some retracements in RSI to make people fool using the default indicator. So we’re just taking the entries in a retracement. (Trading on Retracements).
Google Docs File Link: https://docs.google.com/document/d/1Zl82ky8c1YnfzCgNThXYjMYdk_taTyvmtFRFF85zLZI/edit?usp=sharing
I dedicated this strategy to work only tanaka akiko because he did the EA-Macross before was perfectly done and working fine for me. I will be waiting for your update...
Mr. tanaka akiko , please edit, if in zone only sell dont open any buy oder or in zone only buy dont open any sell oder
What do you mean zone?Mr. tanaka akiko , please edit, if in zone only sell dont open any buy oder or in zone only buy dont open any sell oder
View attachment 88009
Yes men!What do you mean zone?
Above zero line =sell?
Below zero line =buy?
OKYes men!
Can you describe with some pictures?
I thinks you miss something,