- Credits
- 11
OKYes men!
OKYes men!
Can you describe with some pictures?


I thinks you miss something,

It is because of zone.I thinks you miss something,
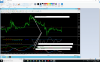
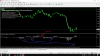
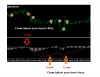
EA does not open oders, where the two lines are cross.
Open Sell when Red line above Blue line
Open Buy when Red line below Blue line
View attachment 88013

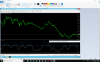
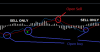
It's in zone, Sell when > zero lineIt is because of zone.
View attachment 88021
You mean red & blue line is above zero level=sell
Yes, but they have to cross and the red line above blue = sell, red below the blue = buy or when the arrow appearsYou mean red & blue line is above zero level=sell
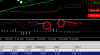
red & blue line is below zero level=buy ?


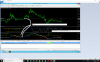
Please make it and I configure different settings to see if it suitsThis indicator signal is always 2candle delay.
is it lagging indicatorYes, but they have to cross and the red line above blue = sell, red below the blue = buy or when the arrow appears
View attachment 88025
View attachment 88026
can tanaka fix the delay ?Please make it and I configure different settings to see if it suits
No, I can not do. It is the indicator logic...can tanaka fix the delay ?
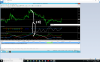
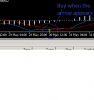
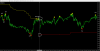
Can you give me profiles or settings?Hi many thanks attached a screenshot of the trades of today
I started using it on my real account on Renko charts for GBPusd and EURUSD as ascalper just oppsite close yes profit 3 pips
View attachment 88007
I fixed.Yes, but they have to cross and the red line above blue = sell, red below the blue = buy or when the arrow appears
View attachment 88025
View attachment 88026

If All 3 indicator shows blue = BUY?View attachment 88011
View attachment 88012
Take profit and stop loss should be the change of the signal of Fl23 Exit

Thank you very much for your efforts, but again, I want to open the order when the blue and red arrows appear or the two lines cross, not just one.
Hello Bro.
you already ask me a part of this EA right, ill give you ratios you can use for either Cent or ECN account
anticipating you are using 4x hedge pair
lot 0.01 = manual input 2$ = basket 4$
lot 0.02 = manual input 4$ = basket 12$
lot 0.03 = manual input 6$ = basket 20$
lot 0.04 = manual input 8$ = basket 28$
if you use 2x hedge pair only then basket is 2,6,10,28