thank u broHemmy, today I coded many EA and kind of tired.
This is yours! Please make money with this and make me be happy..
You are using an out of date browser. It may not display this or other websites correctly.
You should upgrade or use an alternative browser.
You should upgrade or use an alternative browser.
Suggestion I will make a Free EA with your Indicator
- Thread starter winidecorw
- Start date
yes bro.. thanks.add sound alert message only?
You want meesage box also?
also check the EA, is not work as the indicator worked on the chart.. thanks.
Last edited:
How about on time frame M5 the indi and setting use M5 & H1 are still same problem?asa
asasan, sorry I got a problem.
I just checked the indicator signal for H1 and H4 and I found I can not get proper value. H4 signal is flat..........
I don't know why but when I run EA and attach the indicator (H1 & H4) but H4 trend shows incorrect.
I wonder if I can attached both different time frame indicator on the same chart at the same time.......
View attachment 59258
what if for the M5 chart using Super-trend (because basically using that chart too) and in note 7 setting using MTF_Supertrend (H4 / 240 exam, remove other one)asa
asasan, sorry I got a problem.
I just checked the indicator signal for H1 and H4 and I found I can not get proper value. H4 signal is flat..........
I don't know why but when I run EA and attach the indicator (H1 & H4) but H4 trend shows incorrect.
I wonder if I can attached both different time frame indicator on the same chart at the same time.......
View attachment 59258
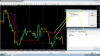
1. example on H1 chart :

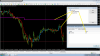
2. example on m5 chart :

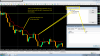
4. example on H4 chart :

do you see the diferent?
Attachments
")

Could you share your settings?
It still revision dont use real.Could you share your settings?
Attachments
DEAR FRIENDS,
AS YOU KNOW, THERE ARE LOTS OF JUNK, REPAINTING AND WORTHLESS INDICATORS AROUND US.
I SUGGEST TO SAVE DEAR TANAKA AND OUR TIME, AND
FIRSTLY EVALUATE ANY INDICATOR IN FORUM BY DECISION OF TRADERS, AND
AFTER CONFIRMATION OF 3 TRADERS, MR TANAKA START HIS WORK ON IT.
PLEASE WRITHE HERE YOUR IDEAS ABOUT IT.
THANKS
AMIR
- Credits
- 0
Thanks you Mr. Tanaka, I forget, can you add max spread to it? (it can be important for some brokers with high spread) here I have make some backtesting, with good result, from M1 to M15Arturombopy,
Please use the attached file.
How to use timefilter, for example if you put time hours
1. start hour 0
2. End hour 10
You can select which way you want (stop EA or Run EA) during the time period.
If you select "Trade EA", EA will trade only 0 :00 to 10:59 time period (broker time)
If you select "Stop EA", then EA will stop from 0:00 to 10:59
If you don't want to use time filer , just select No time filter.
Please try!Don't forget to share the result if you have good result.
View attachment 59246
Attachments
-
 set_tf_m1_hist_30.png51.5 KB · Views: 344
 -
 set_tf_m1_hist_H1.png50.6 KB · Views: 317
 -
 set_tf_m1_hist_H4.png50.6 KB · Views: 313
 -
 set_tf_m5_hist_h1.png51.1 KB · Views: 313
 -
 set_tf_m5_hist_h4.png50.9 KB · Views: 312
 -
 set_tf_m5_hist_M30.png50.8 KB · Views: 313
 -
 set_tf_m15_hist_h4.png51.7 KB · Views: 315
 -
Full_Trades_Strategy_Tester.zip1.4 MB · Views: 99
- Credits
- 0
Hi Bro, It's true, but that happens with most eas, the risk exists, Do you know any ea without risk ? a large part of the eas needs 1000 dollars to trade 0.01 lot, and in some cases 10,000 to trade only 0.01hey bro sory to do this do you sniper work on back data on backtest is awesome but live fails big time from my testing so far
Hi Bro, It's true, but that happens with most eas, the risk exists, Do you know any ea without risk ? a large part of the eas needs 1000 dollars to trade 0.01 lot, and in some cases 10,000 to trade only 0.01
this ea trade according your data and already knows the up and down of market! . always don't believe such a results graph!
Hi bro Tanaka , sorry to disturb you again , that EA you make for me can use but the profit is less.Hi, steve80
Here you go.
i have a idea , if the candle cross Ma we open pending order Buy and Sell, like this i think can reduce SL,
how do you think?? work? Or.....
Attachments
- Credits
- 0
Yes bro, Ido not know if will work perfect, it is new, it is not a know good ea, and it was modified, it is new, I do not know if this work, i will test it, in two week if it work, I will increase risk, example 3% each week, trade in real only 0.01,this ea trade according your data and already knows the up and down of market! . always don't believe such a results graph!
for new traders thad do not know the risk of forex,
first try in demo 2 week or more, if good result on demo, trade only 0.01 in real with two or more weeks, if good result you can increase your risk
- Credits
- 11
asasaswhat if for the M5 chart using Super-trend (because basically using that chart too) and in note 7 setting using MTF_Supertrend (H4 / 240 exam, remove other one)
1. example on H1 chart :
View attachment 59264
2. example on m5 chart :
View attachment 59265
4. example on H4 chart :
View attachment 59267
do you see the diferent?
I got a problem.
I use M5 chart using Super-trend & H4 chart MTF_Supertrend.
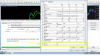
I just code test EA to check how both indicator works in the same chart.
When I attached on the chart it looks good but when I run the EA, it is very different.
You can attach both indicators on the chart before running EA by strategy tester and see how it works.
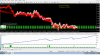
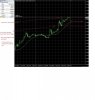
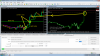
Below picture is super trend chart for comparison.
They are not the same line, it is very different. I think this indicator is always caclulating the value and re-drawing the line that is why when runing EA,
it shows BUY/SELL arrow in what we don't expected.
I just coded the test EA attached.
This EA opens trade when both indicator line cross.
When M5 is above H4, then buy order.
When H5 is above M5, then sell order.
The result is very different from what we expected.

Attachments
Ok Mr. Tanaka, good job, I will check it, and send my report.asasas
I got a problem.
I use M5 chart using Super-trend & H4 chart MTF_Supertrend.
I just code test EA to check how both indicator works in the same chart.
When I attached on the chart it looks good but when I run the EA, it is very different.
You can attach both indicators on the chart before running EA by strategy tester and see how it works.
Below picture is super trend chart for comparison.
They are not the same line, it is very different. I think this indicator is always caclulating the value and re-drawing the line that is why when runing EA,
it shows BUY/SELL arrow in what we don't expected.
View attachment 59303
I just coded the test EA attached.
This EA opens trade when both indicator line cross.
When M5 is above H4, then buy order.
When H5 is above M5, then sell order.
The result is very different from what we expected.
Sent from SoeHoe.ID mobile apps
asasas
I got a problem.
I use M5 chart using Super-trend & H4 chart MTF_Supertrend.
I just code test EA to check how both indicator works in the same chart.
When I attached on the chart it looks good but when I run the EA, it is very different.
You can attach both indicators on the chart before running EA by strategy tester and see how it works.
Below picture is super trend chart for comparison.
They are not the same line, it is very different. I think this indicator is always caclulating the value and re-drawing the line that is why when runing EA,
it shows BUY/SELL arrow in what we don't expected.
thats the problem coding EA with repainting Indis. This will never work! look only good in the past and mostly bad for the future!
- Credits
- 0
hello dear tanaka;
Can you edit the attached EA.
When Ea opens the purchase process, it will generate -500 pips or -600 pips buy stop order. the sum of the two will close at +50 pips.
The buystop order will be canceled if 1 transaction is closed.
Sales transactions in the same way.
Thank you very much.
(sorry for bad english)
Attachments
The logic to open an order is correct, now the EA can add a combination as before.asasas
I got a problem.
I use M5 chart using Super-trend & H4 chart MTF_Supertrend.
I just code test EA to check how both indicator works in the same chart.
When I attached on the chart it looks good but when I run the EA, it is very different.
You can attach both indicators on the chart before running EA by strategy tester and see how it works.
Below picture is super trend chart for comparison.
They are not the same line, it is very different. I think this indicator is always caclulating the value and re-drawing the line that is why when runing EA,
it shows BUY/SELL arrow in what we don't expected.
View attachment 59303
I just coded the test EA attached.
This EA opens trade when both indicator line cross.
When M5 is above H4, then buy order.
When H5 is above M5, then sell order.
The result is very different from what we expected.
1. correct open order :

2. add parameter :

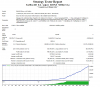
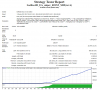
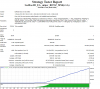
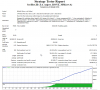
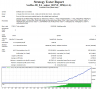
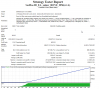
3. Backtest result :
Sett file EUR/USD TF M5:
Attachments
1. If 2nd arrow appers and order has not entered yet, so delete buystop and place buystop due to 2nd arrow?
2. If 2nd arrow appears and the order is already placed due to 1st arrow, place buystop again for 2nd arrow?
Hello,
1) yes
2) only 1 order at a time, nothing else until the open order is closed
Thanks Mr. Tanaka
Hello,
1) yes
2) only 1 order at a time, nothing else until the open order is closed
Thanks Mr. Tanaka
FOR GOD SAKE PLEASE
THIS INDI IS REPAINTING ONE
PLEASE FIRST CHECK YOUR INDIS WITH STRATEGY-TESTER