Thanks very much M Tanaka.It looks good.
Please make sure you have the indicator in your MT4 Market folder.
View attachment 154986
Opposite signal close =true
View attachment 154987
You are using an out of date browser. It may not display this or other websites correctly.
You should upgrade or use an alternative browser.
You should upgrade or use an alternative browser.
New EA LOW DD EA
- Thread starter tanaka akiko
- Start date
- Credits
- 11
people, please post this SuperTrend Nrp New Mtf indicator here
It is in mq5 website and you need to down load from there.
I can't,It is in mq5 website and you need to down load from there.

you can safely pull it out of the terminal on the way .... mql4\indicators\market
Attachments
- Credits
- 11
I can't, View attachment 155022
you can safely pull it out of the terminal on the way .... mql4\indicators\market
You can open your MT4 and on the top right,
Just type
SuperTrend Nrp New Mtf


and it is downloaded in your MT4 market folder automatically.

Attachments

I can't, View attachment 155022
you can safely pull it out of the terminal on the way .... mql4\indicators\market
Attachments
- Credits
- 0
repaints badlyThis is very good indicator, it doesn't repaint, but ea is placing orders regardless of indy.
Mr. Tanaka could you look into the code, this indy could be used as trend and as indy for placing the orders. In this case lines 0,1 should be used as trend line, and those little circles (4,5), could be used for placing the orders as per blue and red line.
thx!
EA works very well.It looks good.
Please make sure you have the indicator in your MT4 Market folder.
View attachment 154986
Opposite signal close =true
View attachment 154987
")
EA works very well.
Doesn't open trade, what TF chart do you work on?
TF:5mnDoesn't open trade, what TF chart do you work on?
It will launch orders when indicator has opposite signal.
Yeah, but the CAC is better as it has reached 100% profit less than 5 monthsyour Adam AUC is looking good....
. With only a 5% higher DD compare to AUCDoesn't open trade, what TF chart do you work on?
Correction, it does open trade. But for EU only since the last 12 hours. Other pairs which I loaded didn't response.

No trade - AU

Attachments
- Credits
- -5
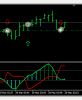
tanaka akikoDear Mr. Tanaka,
Can you kindly make an EA out of this indicator. Thank you.
View attachment 154914
QQE is an abbreviation for the Qualitative Quantitative Estimation. The indicator is based on RSI enhanced using a smoothing technique. Unlike most indicators, Qqe has withstood the test of time regarding volatility changes, especially after the famous 2008 global financial crisis. Better still, it has no lag and rarely produces false signals.
Trend Trading
The indicator is used to determine the trend. If the indicator is moving above the 50 levels, it is an indication that the trend is an ascending/bullish market. Therefore, you should be looking to buy. This means you can use the indicator as a trade filter by opening a long position when the indicator is above the 50-value level and a short position for lower values.
Overbought and oversold positions
You can use the indicator to identify when the price is on oversold and overbought positions. Therefore, when the indicator surpasses the 70 levels, it is a sign of a strong market perfect for a long position. Similarly, you can take a short position if the indicator goes towards negative values.
Divergence
The indicator can help detect price and momentum divergence. For instance, a bullish divergence occurs when the Qqe indicator sets higher lows, but the prices form lower lows. This is a signal of impending bullish reversal.
Contrastingly, a bearish divergence occurs when the Qqe is farming lower highs, but the prices set higher highs indicating a potential bullish reversal.
Also, when the bold line crosses the trailing line, it is an indication of changing momentum. When the bold line crosses above the slow trailing line, it is a tell-tale sign of bullish momentums. Similarly, when the smooth line crosses below the trailing line, it indicates short-term downside momentum.
Thank you for your time and effort. God bless you!
- Credits
- -5
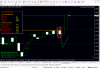
This opened 1 entry yesterday on profit
Correction, it does open trade. But for EU only since the last 12 hours. Other pairs which I loaded didn't response.
View attachment 155036
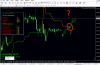
No trade - AU
View attachment 155037
Few issues so far that I observed:
1) EA doesn't always open when signal appears.
2) When set to opposite signal close, it does close upon opposite signal, but it didn't open a new trade according to that new opposite signal
Not worth testing further if the above is not resolved as its not reacting to what and how it should be.
- Credits
- 11
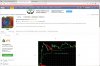
Dear Mr. Tanaka,
Can you kindly make an EA out of this indicator. Thank you.
View attachment 154914
QQE is an abbreviation for the Qualitative Quantitative Estimation. The indicator is based on RSI enhanced using a smoothing technique. Unlike most indicators, Qqe has withstood the test of time regarding volatility changes, especially after the famous 2008 global financial crisis. Better still, it has no lag and rarely produces false signals.
Trend Trading
The indicator is used to determine the trend. If the indicator is moving above the 50 levels, it is an indication that the trend is an ascending/bullish market. Therefore, you should be looking to buy. This means you can use the indicator as a trade filter by opening a long position when the indicator is above the 50-value level and a short position for lower values.
Overbought and oversold positions
You can use the indicator to identify when the price is on oversold and overbought positions. Therefore, when the indicator surpasses the 70 levels, it is a sign of a strong market perfect for a long position. Similarly, you can take a short position if the indicator goes towards negative values.
Divergence
The indicator can help detect price and momentum divergence. For instance, a bullish divergence occurs when the Qqe indicator sets higher lows, but the prices form lower lows. This is a signal of impending bullish reversal.
Contrastingly, a bearish divergence occurs when the Qqe is farming lower highs, but the prices set higher highs indicating a potential bullish reversal.
Also, when the bold line crosses the trailing line, it is an indication of changing momentum. When the bold line crosses above the slow trailing line, it is a tell-tale sign of bullish momentums. Similarly, when the smooth line crosses below the trailing line, it indicates short-term downside momentum.
Thank you for your time and effort. God bless you!
Here is EA.
Just Cross line =Entry and close with opposite signal.

EURUSD M5
Attachments
Last edited: