• Welcome back! Thank you for being a part of this Traders Community. Let's discuss and share :)
    Selamat datang kembali! Trimakasih telah menjadi bagian dari Komunitas Trader ini. Mari berdiskusi dan berbagi :)

New EA LOW DD EA

ok can u make this one an ea.make an open trade when arrow shows up after diamond or give it an option of trading diamonds . or arrows

Indicator has some bug. Can not use it.

upload_2023-4-14_16-29-43.png
 

Attachments

  • upload_2023-4-14_16-29-43.png
    upload_2023-4-14_16-29-43.png
    14.3 KB · Views: 877
hi tanaka,
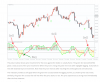
here is the indicator, which on 1hr timeframe in particular looks interesting, using the conservative setting. hope you can produce an EA from that so that one does not need to monitor the markets for hours and hours waiting for a signal to come.

many thanks

YES
upload_2023-4-14_20-59-35.png
 

Attachments

  • upload_2023-4-14_20-59-35.png
    upload_2023-4-14_20-59-35.png
    58.4 KB · Views: 910
  • EA_VMFX ENTRY.ex4
    EA_VMFX ENTRY.ex4
    655.1 KB · Views: 248
Dear Mr. Tanaka,

Can you kindly make an EA out of this indicator. Thank you.

upload_2023-4-14_20-49-30.png

QQE is an abbreviation for the Qualitative Quantitative Estimation. The indicator is based on RSI enhanced using a smoothing technique. Unlike most indicators, Qqe has withstood the test of time regarding volatility changes, especially after the famous 2008 global financial crisis. Better still, it has no lag and rarely produces false signals.

Trend Trading
The indicator is used to determine the trend. If the indicator is moving above the 50 levels, it is an indication that the trend is an ascending/bullish market. Therefore, you should be looking to buy. This means you can use the indicator as a trade filter by opening a long position when the indicator is above the 50-value level and a short position for lower values.

Overbought and oversold positions
You can use the indicator to identify when the price is on oversold and overbought positions. Therefore, when the indicator surpasses the 70 levels, it is a sign of a strong market perfect for a long position. Similarly, you can take a short position if the indicator goes towards negative values.

Divergence
The indicator can help detect price and momentum divergence. For instance, a bullish divergence occurs when the Qqe indicator sets higher lows, but the prices form lower lows. This is a signal of impending bullish reversal.

Contrastingly, a bearish divergence occurs when the Qqe is farming lower highs, but the prices set higher highs indicating a potential bullish reversal.

Also, when the bold line crosses the trailing line, it is an indication of changing momentum. When the bold line crosses above the slow trailing line, it is a tell-tale sign of bullish momentums. Similarly, when the smooth line crosses below the trailing line, it indicates short-term downside momentum.


Thank you for your time and effort. God bless you!
 

Attachments

  • qqe-indicator.ex4
    qqe-indicator.ex4
    45.1 KB · Views: 87
  • upload_2023-4-14_20-49-30.png
    upload_2023-4-14_20-49-30.png
    226 KB · Views: 900
tanaka akiko can u recommend me what the most profit ea the last i use is EA Tesshinsho but since i dont know it outdate or not because blue line it not update if market update the price here the EA tesshinso is good profit but in real it not great
 

Attachments

Hello Mr. tanaka akiko

Can u make EA from this indicator? i'm not sure where i get it this indicator, but i already forward test around 2 weeks on XAUUSD in TF H1 about this indicator and it's really not repaint. Entry based on signal that appears. And close the entry based on the opposite signal. Sometimes, it's give two or three signal but just follow the signal on the entry. Maybe if it's work, it's can help more people on this forum to make it money. Thank you.
 

Attachments

OK, I coded EA but I can not test, so your support is always helpful.
This is very good indicator, it doesn't repaint, but ea is placing orders regardless of indy.
Mr. Tanaka could you look into the code, this indy could be used as trend and as indy for placing the orders. In this case lines 0,1 should be used as trend line, and those little circles (4,5), could be used for placing the orders as per blue and red line.
thx!
 

Attachments

Attachments

  • upload_2023-4-18_10-50-48.png
    upload_2023-4-18_10-50-48.png
    25.5 KB · Views: 773
  • upload_2023-4-18_10-51-1.png
    upload_2023-4-18_10-51-1.png
    97 KB · Views: 783
  • EA_SuperTrend Nrp New Mtf.ex4
    EA_SuperTrend Nrp New Mtf.ex4
    333 KB · Views: 141
Back
Top