• Welcome back! Thank you for being a part of this Traders Community. Let's discuss and share :)
    Selamat datang kembali! Trimakasih telah menjadi bagian dari Komunitas Trader ini. Mari berdiskusi dan berbagi :)

Suggestion I will make a Free EA with your Indicator

hello tanaka is there a way of making arrows of that indicator stick without disappearing when i change time frame i would really love to use it as an indicator not an ea . please i beg if u can make it non repaint it would really be nice
 
hello tanaka is there a way of making arrows of that indicator stick without disappearing when i change time frame i would really love to use it as an indicator not an ea . please i beg if u can make it non repaint it would really be nice
 

Attachments

Mr. Tanaka here is nice Scalping Arrow ,no mq.4 file , remind's me of Ultimate pro signal, but better, with SuperTrend would probably create nice scalping EA.
Or just as standalone signal.
I've just started using it manually on 1min chart, doesn't repaint, result's are promising.
See what you think, thx !
 

Attachments

  • Scalping Arrow.ex4
    Scalping Arrow.ex4
    35.8 KB · Views: 89
  • Scalping Arrow.PNG
    Scalping Arrow.PNG
    111.6 KB · Views: 217
  • Scalping Arrow-2.PNG
    Scalping Arrow-2.PNG
    116.3 KB · Views: 198
  • Scalping Arrow plus SuperTrend.PNG
    Scalping Arrow plus SuperTrend.PNG
    83.1 KB · Views: 202
Last edited:
Hello Mr. Tanaka please make an EA based only with indi White Arrow. Open order on every showing arrow and close all orders on opposite signal. I know you have make it on EA Combine 3 indi rev B but I still confused if I want to use EA only with indi white arrow. Thank you
 

Attachments

Hello Mr. Tanaka please make an EA based only with indi White Arrow. Open order on every showing arrow and close all orders on opposite signal. I know you have make it on EA Combine 3 indi rev B but I still confused if I want to use EA only with indi white arrow. Thank you
Are you sure
See picture
 

Attachments

  • Screenshot_20220410-175048_Microsoft Remote Desktop.jpg
    Screenshot_20220410-175048_Microsoft Remote Desktop.jpg
    596 KB · Views: 188
  • Screenshot_20220410-181813_Microsoft Remote Desktop.jpg
    Screenshot_20220410-181813_Microsoft Remote Desktop.jpg
    522.8 KB · Views: 173
guy I never saw in the last 10 years.. that an Indicator with less than 100kb is really good for a trading market.. sorry... please TEST the indicators first manually! and look carefully if this read the history if you do a BT.. dont let tanaka code each shit... because we backtester... test this shit too.. what costs.. time.. and pc power! thx in advance and for the understanding
 
If you found a profitable EA, whether it be cracked or the original version, would you share it here or be scared because your broker might find out and disable your account. Because so many people would be using it and making a profit that the people who control the stock market will go bankrupt. Furthermore, would you sell it for a small profit or post it free here? Because till now, there are no winning strategies, indicators or EA's. Unless there are profitable holy grails, but nobody would like to share, because they have lost so much already and would like to keep it all for themselves. What are your thoughts on this? Should a profitable system be shared to a newbie or shared only among the people who have been testing, investing time, and resources.
 
Hello Mr. Tanaka please make an EA based only with indi White Arrow. Open order on every showing arrow and close all orders on opposite signal. I know you have make it on EA Combine 3 indi rev B but I still confused if I want to use EA only with indi white arrow. Thank you
It is not bad when used with supertrend, 30 min chart, I've left it on ETHUSD, you get few extra arrows, but overall looks profitable.
EA based on those 2 indy's would be nice !
thx!
 

Attachments

  • White-arrow.PNG
    White-arrow.PNG
    99 KB · Views: 143
If you found a profitable EA, whether it be cracked or the original version, would you share it here or be scared because your broker might find out and disable your account. Because so many people would be using it and making a profit that the people who control the stock market will go bankrupt. Furthermore, would you sell it for a small profit or post it free here? Because till now, there are no winning strategies, indicators or EA's. Unless there are profitable holy grails, but nobody would like to share, because they have lost so much already and would like to keep it all for themselves. What are your thoughts on this? Should a profitable system be shared to a newbie or shared only among the people who have been testing, investing time, and resources.
if you look around.. I share all what I have.. and all what others are asking for.. if I have good connection to can share it free.. that is my way of life.. help to be helped one day too
 
Hi Mr Tanaka I would like to know if you can create a profitable EA with this indicator with time H1.
Strategy:
SweetSpots_Indicator_For_MT4.gif

The SweetSpots Indicator For MT4 automatically plots horizontal lines on round numbers (00 and 50). It has been typically observed that these round price levels tend to carry more importance than others. More often than not, an asset price will stop at round number levels to decide whether it wants to continue a move or reverse direction.
Going across your screen you will find that there are horizontal lines which specify certain sweet spot levels which are automatically drawn which have price points that end with double zero or fifty. The price levels which end with 00 at the end get a red horizontal line each whereas the price levels suffixed with 50 at the end get green lines as shown by the screenshot below.

SweetSpots_Indicator_For_MT4_2.gif


SweetSpots Indicator For MT4 - Support And Resistance

These round-numbered levels are psychological support and resistance levels because traders from all over the world monitor these levels and as soon as price approaches any of these points many traders jump in to catch bounces off these points.

It may not be a complete reversal but it will just be a slight rejection and maybe the market might even continue following through with its initial direction. However, this may not always be the case - sometimes the market just goes right through this point without any resistance but most of the time these lines are deemed sweet spots from which you may trade off.

In a way, this indicator is just like the pivot point indicator which is a combination of support and resistance lines equally spaced out below and above the main pivot line using a different method of calculation such as Fibonacci. The only difference is that instead of using Fibonacci calculations or any other calculations, it just draws 10 lines on either side of the main middle line marking off the price points which end with double zero or 50 at the end.

So that gives you a total of 20 Lines specified. But when you notice that you do not have enough horizontal sweet spots being drawn for you in your screen - you could just adjust the default settings so that you can add more lines in by simply typing in a number greater than 10. In the image below, I opted to go for 20 lines so that it will have 40 sweet spot lines in total.

SweetSpots_Indicator_For_MT4_3.gif


SweetSpots Indicator For MT4 - Buy Entries

As a word of caution, I would not look at trading the market by just using this as my only indicator to draw conclusive triggering points for opening up my trades.

So what you could do is maybe add in a Fibonacci retracement tool and then based on the recent price movement or price activity you could then choose to swing the Fibonacci retracement tool across the explicit down or up swings in the market. And then what you could do is then look for levels where the sweet spot levels come into confluence. The Fibonacci retracement levels that you may look at is the 61.8 ratio or the 78.6 ratio just like the picture shown below.

SweetSpots_Indicator_For_MT4_4.gif


You will then see whether or not these levels are aligned with the different sweet spot zones. Using it in this manner gives you an added-confirmation to validate possible reversal trades. Furthermore, you can extend this prebviously mentioned use-case for your money management principles.

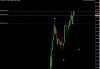
So what can happen is that the sweet spot levels can be used as zones to set your stop losses and your various take profit targets if indeed you have more than one trade open. This will just make your trade management more seamless and neat. Based on the Fibonacci mehod of trading - a buy trade was identified when the market reached the 78.6 level as it corresponded quite closely with one of the sweet spot levels.

This in turn formed a great buying opportunity because there was also a bullish engulfing pattern that had formed thus staking the odds in our favor. As the hours went by for the rest of the day, the market did indeed go up in line with our bullish outlook as shown below.

SweetSpots_Indicator_For_MT4_5.gif


With a trading strategy like this it is paramount that you do not become to leniant or loose with your buying or selling decision making process. You need to remain consistent and disciplined. If you choose 61.8 confluence then go with that.

If you choose 78.6 confluence, then go with that. Just remain strict as far as your intended entry signal is concerned. These trade setups occur on all time frames therefore, you will never run out of trading opportunities. They are plentiful, so do not trade outside of your trading plan.

Thank you very much if you do it for me I will offer you a cup of coffee on your paypal
 

Attachments

Back
Top