Yes sir I am looking to basket profit 2 orders first order any expert second order from mother copy expert same mother magicYou want to close only specified magic#?
Just one? How many blanks do you need for magic#?
You are using an out of date browser. It may not display this or other websites correctly.
You should upgrade or use an alternative browser.
You should upgrade or use an alternative browser.
Suggestion I will make a Free EA with your Indicator
- Thread starter winidecorw
- Start date
Example sell order Gbpusd (super arrow b) & buy order eurusd (mother copy) = close basket profit = 0.10 $Yes sir I am looking to basket profit 2 orders first order any expert second order from mother copy expert same mother magic
Yes sir I am looking to basket profit 2 orders first order any expert second order from mother copy expert same mother magicYou want to close only specified magic#?
Just one? How many blanks do you need for magic#?
Example sell order Gbpusd (super arrow b) & buy order eurusd (mother copy) = close basket profit = 0.10 $
- Credits
- 0
- Credits
- 11
OK, I added Manual input for MAGIC #Yes sir I am looking to basket profit 2 orders first order any expert second order from mother copy expert same mother magic
Example sell order Gbpusd (super arrow b) & buy order eurusd (mother copy) = close basket profit = 0.10 $
You can specify to close order by MAGIC#.
Select Magic Type =Manual input
Then, specify MAGIC# to close orders.
If you want to close mother EA and COPY EA both, then you put Mother EA magic# and COPY EA (child EA) magic#.

Attachments
- Credits
- 11
This indicator has no output signal, so I can not make EA.Tanaka, Can you please make this into EA when it gives the signal to enter trade, with S/L and the 3 TP, when the first T/P level is hit, T/P 2 & 3 trades S/L are modified to breakeven.

Attachments
- Credits
- 13
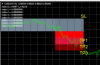
I have a strange problem with SA: multiple orders occur after New York close for a couple hours.
One account had a problem but five other accounts had no issue.
All accounts use same settings.
Max Spread = 20, I have lowered this on problem account to MS 10 and hope this resolves it.
I have ruled out EA conflicts.
This is a similar problem to previous issue (unresolved) where EA continually logs message in Expert log "chart order closed with busket profit" and ceases operations. I cannot run SA on that account as it begins same error / bug immediately (luckily no trades occur).
The EA is still operating on this account.
Anyone else have this issue and a solution please?
Max Spread 10 didn't resolve this. And it happened just now again...539 trades since market open five hours ago.
I am now trying Max Spread 5, but it seems Super Arrow is getting triggered too often by market - should I use a filter to stop this?
Or is this a bug in SA?
Mr Tanaka, please check this?

Attachments
- Credits
- 0
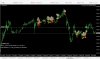
You need to define specific logic ,, RSI have touched 65-70 level recently is not specific.
I coded like
1. Check candle touch (if candle lowest is below SMA line) to entry order.
2. If above rule is true, then check RSI value of previous bar and if it is more than RSI70, then entry.
View attachment 88112
We're considering RSI 65-70 and more above [Buying-Zone] (If this area touches and turns back down market a little bit) then again cross the SMA-10 with a bullish candle is a buy order.
We're considering RSI 35-30 and more below [Selling-Zone] (If this area touches and turns back up market a little bit) then again cross the SMA-10 with a bearish candle is a buy order.
The candle can touch with tail, body, head, no problems.
If you have more confusions, I can make a video tutorial within the next 5 hours.
- Credits
- 11
The problem occurs in one account? Was the sever restart? I have no idea what is happening. Maybe you can try re-start MT4 again and attach EA again?Max Spread 10 didn't resolve this. And it happened just now again...539 trades since market open five hours ago.
I am now trying Max Spread 5, but it seems Super Arrow is getting triggered too often by market - should I use a filter to stop this?
Or is this a bug in SA?
Mr Tanaka, please check this?
View attachment 88124
- Credits
- 11
We're considering RSI 65-70 and more above [Buying-Zone] (If this area touches and turns back down market a little bit) then aWe're considering RSI 65-70 and more above [Buying-Zone] (If this area touches and turns back down market a little bit) then again cross the SMA-10 with a bullish candle is a buy order.
We're considering RSI 35-30 and more below [Selling-Zone] (If this area touches and turns back up market a little bit) then again cross the SMA-10 with a bearish candle is a buy order.
The candle can touch with tail, body, head, no problems.
If you have more confusions, I can make a video tutorial within the next 5 hours.
Yes, this is the problem. You need to decide the RSI 65-70 zone..... like.... how many candlestick back and check RSI value and if the price is above RSI for 3 candle stick then buy order.. etc..
- Credits
- 0
We're considering RSI 65-70 and more above [Buying-Zone] (If this area touches and turns back down market a little bit) then a
Yes, this is the problem. You need to decide the RSI 65-70 zone..... like.... how many candlestick back and check RSI value and if the price is above RSI for 3 candle stick then buy order.. etc..
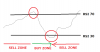
Okay, We do it by visualizing. While I can make you understand the conditions better by from the buying zone RSI Default (14) 65-70 level touched gone more up and then it may fall maximum up to RSI 40 level, or between 40 to anything up it may drag and drop. Then if a bullish candle crossed the sma-10 line it's a buy.
selling zone RSI Default (14) 35-30 level touched gone more down and then it may go up maximum up to RSI 60 level, or between 35 to anything down it may drag and drop. Then if a bearish candle crossed the sma-10 line it's a buy.
Visualizing from a trader's prospective it makes it understand a lot better. If you need a described video about it I will update asap as I'm on University Library now and I will update once I go back home !
- Credits
- 11
Please just draw picture!Okay, We do it by visualizing. While I can make you understand the conditions better by from the buying zone RSI Default (14) 65-70 level touched gone more up and then it may fall maximum up to RSI 40 level, or between 40 to anything up it may drag and drop. Then if a bullish candle crossed the sma-10 line it's a buy.
selling zone RSI Default (14) 35-30 level touched gone more down and then it may go up maximum up to RSI 60 level, or between 35 to anything down it may drag and drop. Then if a bearish candle crossed the sma-10 line it's a buy.
Visualizing from a trader's prospective it makes it understand a lot better. If you need a described video about it I will update asap as I'm on University Library now and I will update once I go back home !
- Credits
- 11
Can you show like this?Some problems detected in visuals. Can you do a visual test from your end and match it with yours? Only the entries should happen according to conditions. Please, dear focus on the conditions and please let me know. It should take entries on right conditions only.

Attachments
Thank you for answer I test over night and send coffeeOK, I added Manual input for MAGIC #
You can specify to close order by MAGIC#.
Select Magic Type =Manual input
Then, specify MAGIC# to close orders.
If you want to close mother EA and COPY EA both, then you put Mother EA magic# and COPY EA (child EA) magic#.
View attachment 88121
 ️ for you sir
is this open 1 pair (no Reverse mode like Hedge setting), right?here you go.. dont blow your account..
- Credits
- 0
Hello my friend
If it is possible for you
Convert this indicator to EXPERT
Sincerely thank you in advance for your assistance
http://s4.picofile.com/file/8363329768/Forex_Gump.ex4.html

If it is possible for you
Convert this indicator to EXPERT
Sincerely thank you in advance for your assistance
http://s4.picofile.com/file/8363329768/Forex_Gump.ex4.html
Klik Alfan
New Member
- Credits
- 0
Please, can you make a filter so that 2 EMAs work together with the Strategy in it, and I need the mql file as learning if you wishthis EA is working, gave error here ,,,
Herdyansyah
Member
- Credits
- 0
hai tanaka akiko I tried ea titanxpro BT in 2018-2019 to get a profit, but tried in 2017-2018 the account was destroyed. try you BT in 2017, please share the results and set
you use only for EU, 1 EU normal (reverse FALSE), and 1 EU with Reverse (TRUE), right?Cool.
this is mine with 200 balance
https://www.myfxbook.com/members/shlord/super-arrow-revb/3347897
- Credits
- 11
For me it is expired.Hello my friend
If it is possible for you
Convert this indicator to EXPERT
Sincerely thank you in advance for your assistance
http://s4.picofile.com/file/8363329768/Forex_Gump.ex4.html
but you can try.