• Welcome back! Thank you for being a part of this Traders Community. Let's discuss and share :)
    Selamat datang kembali! Trimakasih telah menjadi bagian dari Komunitas Trader ini. Mari berdiskusi dan berbagi :)
General chit-chat
Help Users
  • No one is chatting at the moment.

      Suggestion the only indicator you will ever need to be consistent in forex.

      Cool friend, are you Brazilian? I like to make entries in m5, so I left m5 and h1, is that correct?
      Yes, it is recommended to only make entries during the NY session and never operate during news. I currently use M15.notocias.png
       

      Attachments

      • notocias.png
        notocias.png
        71.8 KB · Views: 317
      TPSpro RFI Levels

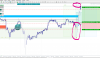
      A key element in trading is zones or levels from which decisions to buy or sell a trading instrument are made. Despite attempts by major players to conceal their presence in the market, they inevitably leave traces. Our task was to learn how to identify these traces and interpret them correctly.


      https://www.mql5.com/en/market/product/106671?source=External#description

      Your statement effectively captures a fundamental principle of trading: the importance of identifying key zones or levels where major buying or selling activity occurs. These levels often represent areas of strong support and resistance, where institutional traders and large market participants execute significant orders.

      Even though major players attempt to conceal their market activities to avoid revealing their strategies, they inevitably leave traces in price action, volume spikes, and order flow patterns. Recognizing these footprints allows traders to anticipate potential market moves and make better trading decisions.

      For example, in XAUUSD, we can observe how institutional players leave their mark on the market. Suppose Gold is trading in a range between $2,000 and $2,050 per ounce, with multiple rejections at these levels. If price consistently finds strong buying pressure around $2,000, it indicates a demand zone where large traders are accumulating positions. Conversely, repeated sell-offs near $2,050 suggest a supply zone where big players are offloading positions.

      A common method to identify these zones is through volume analysis and candlestick patterns. If Gold suddenly drops to $2,000, and we see a long wick rejection with increased volume, it could signal institutional buying. On the other hand, if price approaches $2,050 with declining momentum and forms a bearish engulfing candle, it may indicate that large sellers are stepping in.

      By learning to spot these traces left by major players, traders can enhance their ability to enter high-probability trades. For instance, buying near $2,000 with a stop-loss just below and targeting $2,050 offers a favorable risk-reward setup. Similarly, shorting near resistance zones can be a strategic approach.

      Ultimately, mastering the skill of identifying these key levels and interpreting market movements accordingly can significantly improve a trader’s success in navigating volatile markets like XAUUSD.
      Good, currently I only use XAUUSD in M15, more assertive for me
       
      amigo vc tem telegram? tambem sou brasileiro.... estou anos tentando e me esforçando muito.... gostaria de bater um papo com vc no zap
      saitama.png
      não uso Telegram amigo, pode perguntar aqui que sempre que possível respondo ou compartilho alguma ferramenta se precisar.
       

      Attachments

      • saitama.png
        saitama.png
        107.1 KB · Views: 237
      Back
      Top