You are using an out of date browser. It may not display this or other websites correctly.
You should upgrade or use an alternative browser.
You should upgrade or use an alternative browser.
My Scalping Trade
- Thread starter mutenext
- Start date

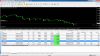
this trade went wrong i closed it with 6$ lose why i lost this one?


Hemmy. Sorry mate but you didnt understand yet. Please follow me:
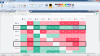
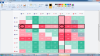
Pairs are divide in 2 parts AAA + BBB --> AAABBB,
Lets say you´re watching BBB vertical:
BBB is RED vertical --> SELL XXXBBB; BBB is GREEN vertical --> BUY XXXBBB;
Now Lets say you´re watching AAA horizontal:
AAA is GREEN horizontal --> BUY AAAXXX; AAA is RED horizontal --> SELL AAAXXX
In your previous image,
JPY is red vertical (most bars red for all pairs) so you would look to SELL any XXXJPY
and
CHF is green horizontal (most bars green for all pairs) so you would look to BUY any CHFXXX
So in this case you would BUY CHFJPY (you are buying CHF and selling JPY)
NOTE: CHFJPY would have to be above +4% to buy
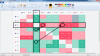
Wow. You Got It. The Answer is !!!Angle!!!.I found a better MT4 indicator for similar trade setup.
Attach the indicator to the chart, set to display only that two currency pairs. Example, setting CAD and JPY to true when attaching to CADJPY.
You can also set the level to enter trade, example, 0.4.
The indicator comes with alert too.
Since the indicator provides buffer values, you may request Mr Tanaka Akiko to code the EA for us.
Enter trades only after crossed and angled out hitting level of 0.4 and above etc...
Then you can watched your sports while EA trading automatically for you...
View attachment 54546
")
Research Angle. You can be a Forex master.
And next month I will open MAM account at Ic-markets.
Try it demo first and make 5~10pips for a day. Do it for 2 months. If you are going right, You can make double for 2 months.
Affter vacation, This week trade history.

Good-Luck Everybody.
And next month I will open MAM account at Ic-markets.
Try it demo first and make 5~10pips for a day. Do it for 2 months. If you are going right, You can make double for 2 months.
Affter vacation, This week trade history.
Good-Luck Everybody.
Thank you mutenext for teaching us this strategy. Please can you tell us in detail how you implement your stoploss? attached is my trade result since yesterdayResearch Angle. You can be a Forex master.
And next month I will open MAM account at Ic-markets.
Try it demo first and make 5~10pips for a day. Do it for 2 months. If you are going right, You can make double for 2 months.
Affter vacation, This week trade history.
Good-Luck Everybody.
Attachments
thanks for explaining i hope i would not disappoint ... your effort.Hemmy. Sorry mate but you didnt understand yet. Please follow me:
Pairs are divide in 2 parts AAA + BBB --> AAABBB,
Lets say you´re watching BBB vertical:
BBB is RED vertical --> SELL XXXBBB; BBB is GREEN vertical --> BUY XXXBBB;
Now Lets say you´re watching AAA horizontal:
AAA is GREEN horizontal --> BUY AAAXXX; AAA is RED horizontal --> SELL AAAXXX
In your previous image,
JPY is red vertical (most bars red for all pairs) so you would look to SELL any XXXJPY
and
CHF is green horizontal (most bars green for all pairs) so you would look to BUY any CHFXXX
So in this case you would BUY CHFJPY (you are buying CHF and selling JPY)
NOTE: CHFJPY would have to be above +4% to buy
thanks to everybody in this thread participate and help each specially me..i tried today on demo.. but i have still confused mind yet not clear yet.. today trading history one is still running -18 pips minus.. but let see where it will go..

Attachments

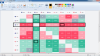
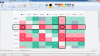
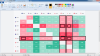
audchf here we would sell right? aud pair horizontal red line (sell line)and confrim with vertical line aud is buy line .. so here aud/chf is open sell order??
View attachment 54668
yes!
Another more simples way to see...
Just look at horizontal lines Green -> Buy; Red --> Sell
AUD - Red; CHF - Green --> Sell AUDCHF
Much more simple!
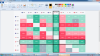
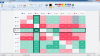
here we can go for buy trade usdcad??yes!
Another more simples way to
Just look at horizontal lines Green -> Buy; Red --> Sell
AUD - Red; CHF - Green --> Sell AUDCHF
Much more simple!