• Welcome back! Thank you for being a part of this Traders Community. Let's discuss and share :)
    Selamat datang kembali! Trimakasih telah menjadi bagian dari Komunitas Trader ini. Mari berdiskusi dan berbagi :)
General chit-chat
Help Users
  • No one is chatting at the moment.

      My Scalping Trade

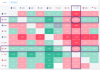
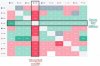
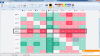
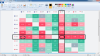
      It shows the relative strength of the currency on the vertical versus the currency on the horizontal.

      View attachment 54509

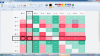
      For NZD, it shows 0.92 % weaker than USD and 0.6 % weaker than AUD.

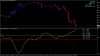
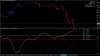
      So we should be looking to short NZD. Therefore we should be Short NZDUSD or Long AUDNZD. Long or Short will depend on weather the currency is base or quote.

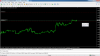
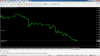
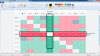
      Open the currency pair on MT4, say M15, you will be clear, now NZDUSD is moving down and AUDNZD is moving up because NZD is weak comparing to USD and AUsoD.

      View attachment 54511

      so we should nzd currency both sell and sell option???

      upload_2018-8-30_16-24-53.png
       

      Attachments

      • upload_2018-8-30_16-24-53.png
        upload_2018-8-30_16-24-53.png
        409.3 KB · Views: 769
      J K1368 please read this post he said

      You cannot buy or sell only one currency in FX, they trade in pairs.
      The heat chart shows the relative strength of currency listed on extreme vertical axis against those on horizontal axis.
      On the vertical axis on the left, we pick NZD, then looking across horizontally, we see Red for both USD (listed on Horizontal axis) meaning we should go short.
      Again, if you not clear, suggest you open each chart on MT4 to confirm the price movement.
      Please see attached NZDUSD in my previous post.
       
      I found a better MT4 indicator for similar trade setup.
      Attach the indicator to the chart, set to display only that two currency pairs. Example, setting CAD and JPY to true when attaching to CADJPY.
      You can also set the level to enter trade, example, 0.4.
      The indicator comes with alert too.
      Since the indicator provides buffer values, you may request Mr Tanaka Akiko to code the EA for us. ;)
      Enter trades only after crossed and angled out hitting level of 0.4 and above etc...
      Then you can watched your sports while EA trading automatically for you...

      CADJPYM15.jpg
       

      Attachments

      I found a better MT4 indicator for similar trade setup.
      Attach the indicator to the chart, set to display only that two currency pairs. Example, setting CAD and JPY to true when attaching to CADJPY.
      You can also set the level to enter trade, example, 0.4.
      The indicator comes with alert too.
      Since the indicator provides buffer values, you may request Mr Tanaka Akiko to code the EA for us. ;)
      Enter trades only after crossed and angled out hitting level of 0.4 and above etc...
      Then you can watched your sports while EA trading automatically for you...

      View attachment 54546
      i will ask tanka to code ea but please can u explain more about rules of open entry and Sl and TP
       
      i will ask tanka to code ea but please can u explain more about rules of open entry and Sl and TP

      Same as described by mutenext in earlier posts, he mentioned trade only if more than 0.4 (absolute value, regardless + or -), TP=10 SL=50, used MM, use trailing SL etc
      These should be variable parameters for optimization.

      Trade.jpg
       

      Attachments

      • Trade.jpg
        Trade.jpg
        47.9 KB · Views: 773
      guess no one read my posts.. anyway.. looks supereasy now.upload_2018-8-30_17-55-25.png
       

      Attachments

      • upload_2018-8-30_17-55-25.png
        upload_2018-8-30_17-55-25.png
        67.3 KB · Views: 767
      you mark circle usd and chf ... and JPY... you would open trad on usd/jpy and chf/jpy or usdchf????
       
      you mark circle usd and chf ... and JPY... you would open trad on usd/jpy and chf/jpy or usdchf????
      please check my previous posts where there is a link explaining how to take trades. I would buy usdjpy and chfjpy
       
      i see i just noticed that usd 0.43% and jpy -0.48%
      chf 0.51% and jpy -0.44%

      so you check first left to right which one is more then +3.5% and from up to down which one is more the -3.5%.. right i am checking your previous post\
       
      i check for strong buy or sell on all pairs then i match them. If i get >0.4% ou -0.4% looks good entry.
      upload_2018-8-30_18-33-38.jpeg
       

      Attachments

      • upload_2018-8-30_18-33-38.jpeg
        upload_2018-8-30_18-33-38.jpeg
        75 KB · Views: 769
      here nzd pair strong buy and strong sell showing what to do next?upload_2018-8-30_23-15-17.png
       

      Attachments

      • upload_2018-8-30_23-15-17.png
        upload_2018-8-30_23-15-17.png
        424.4 KB · Views: 752
      Example) Usdcad and Cadjpy.

      You can take 10pips from these two pairs.

      53mins before Forex Hit Map was over 0.4%(+,-)

      I didn't take a screenshot at that time.

      https://s8.postimg.cc/gx03r2y2d/fhm1.png

      It is enough today.

      https://s8.postimg.cc/8eqnmtc51/usdcad.png

      English is not my mother language. i am not good at eng,

      But don't greedy 5or 10pips is enough for a day.
      according to this screen shoot

      usd/cad
      cad/jpy

      first step we check currency where is more then 0.4% and we check horizontal line where it is..as we find usd 0.38% on cad horizontal line right!!!! so next we look cad pair if there is is more then -0.3.5% and here we have -0.36%.

      so here we go for buy position right??


      second scenerio about cad/jpy.. find one where is more then +0.3.5% and we find cad 0.38% and and jpy -.2% so here cadjpy we go for buy again right!!
      same precedure we check is this correct??
       
      exemple:
      A. jpy is red vertical line... we look to sell jpy.
      B. usd is green horizontal line --> we look to buy usd

      Result: usdjpy +0.46% --> BUY USDJPY

      Got it?
       
      upload_2018-8-30_22-27-35.png
       

      Attachments

      • 2018-08-30_22-26-52.jpg
        2018-08-30_22-26-52.jpg
        28.5 KB · Views: 142
      • upload_2018-8-30_22-27-35.png
        upload_2018-8-30_22-27-35.png
        75.4 KB · Views: 765
      exemple:
      A. jpy is red vertical line... we look to sell jpy.
      B. usd is green horizontal line --> we look to buy usd

      Result: usdjpy +0.46% --> BUY USDJPY

      Got it?
      ok i try to send screen shoot please check it if it is correct or i did mistake again..here i checked heatmap and find usd and cad usd is -0.34% and cad is -0.41% here is opened sell trade it is ok??

      upload_2018-8-31_12-22-6.png


      upload_2018-8-31_12-21-50.png
       

      Attachments

      • upload_2018-8-31_12-21-50.png
        upload_2018-8-31_12-21-50.png
        139.6 KB · Views: 763
      • upload_2018-8-31_12-22-6.png
        upload_2018-8-31_12-22-6.png
        428 KB · Views: 748
      here second one is cadchf
      cad -0.39% and chf0.38% here sell order open
      upload_2018-8-31_12-26-19.png


      upload_2018-8-31_12-26-4.png
       

      Attachments

      • upload_2018-8-31_12-26-4.png
        upload_2018-8-31_12-26-4.png
        144.1 KB · Views: 755
      • upload_2018-8-31_12-26-19.png
        upload_2018-8-31_12-26-19.png
        417.7 KB · Views: 741
      Back
      Top