• Welcome back! Thank you for being a part of this Traders Community. Let's discuss and share :)
    Selamat datang kembali! Trimakasih telah menjadi bagian dari Komunitas Trader ini. Mari berdiskusi dan berbagi :)

Suggestion My Holy Grail After 4 years of trading

Okay, thanks. I just entered Eurjpy today and others, I intend to keep it long as possible as I now have an idea how long it will take to see a probable figures base on my lot size. I just needed more confirmation.


As Ridzuan already explained the key confirmation factors i followed are;

-X on both H1 and m15
-Arrow is a must and should align with X on H1
-Number on h1 (could be any)
-M15 must be in the zone
-RSI must be 70-75
-Stoch must 90-95

Please kindly correct if my confirmation Summery is wrong.

Best regards

Summary is correct.

Guz
 
Hi,

I see a system buy signal for USD/CAD that aligns with EW, this is a strong buy signal. I'm aiming for 40 - 50 pips.

Guz


I see this too Guz, do you think it's safe to enter without the arrow on h1? Do you think there will be no further drawdown?

Thanks for guiding
 
I see this too Guz, do you think it's safe to enter without the arrow on h1? Do you think there will be no further drawdown?

Thanks for guiding

Could be your broker, I have arrows on m15 and H1. I entered the trade.

My brokers:
Bernstein Bank (Germany)
OANDA FX

Guz
 
I use window 10 pro, if you look at the image uploaded you will notice I have fib running. I suggest you make a total reinstallation and make sure fib is active on your indicator list.
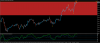
fb active meaning ? pls see the attached image... in this fibo level 100% with line is shown and thats the only level it shows on the charts and its same for all pairs...
i have uninstalled and re-installed 3 times but the issue is still there...
what exactly u mean by fb active, u mean its loaded on the chart?
 

Attachments

  • audusd.png
    audusd.png
    41.9 KB · Views: 257
fb active meaning ? pls see the attached image... in this fibo level 100% with line is shown and thats the only level it shows on the charts and its same for all pairs...
i have uninstalled and re-installed 3 times but the issue is still there...
what exactly u mean by fb active, u mean its loaded on the chart?


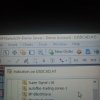
You should have this active.


From your menu
Charts - indicator list
 

Attachments

  • IMG_20200601_184851_1.jpg
    IMG_20200601_184851_1.jpg
    2.5 MB · Views: 276
You should have this active.


From your menu
Charts - indicator list

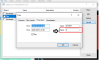
it is loaded in the chart, i can see it.... I am comparing it to the windows 7 laptop where its showing everything fine... there is difference i can see when i check the objects list and check fibo settings....parameter value is showing 0 (highlted in red square box) whereas in windows 7 laptop when i check, there is pair price given instead of 0, and this is with all pairs.... maybe thats why its not showing fib levels... pls see the image of windows 10 fib settings in objects list settings...
 

Attachments

  • fib parameter-win10.png
    fib parameter-win10.png
    26.4 KB · Views: 277
it is loaded in the chart, i can see it.... I am comparing it to the windows 7 laptop where its showing everything fine... there is difference i can see when i check the objects list and check fibo settings....parameter value is showing 0 (highlted in red square box) whereas in windows 7 laptop when i check, there is pair price given instead of 0, and this is with all pairs.... maybe thats why its not showing fib levels... pls see the image of windows 10 fib settings in objects list settings...
ridzuan can u pls see the image in earlier post i sent... this is the only difference i can see... pls help how to fix... the fib levels are still not showing, i have re-installed multiple times now :(
 
ridzuan can u pls see the image in earlier post i sent... this is the only difference i can see... pls help how to fix... the fib levels are still not showing, i have re-installed multiple times now :(

gv me your teamviewer id & password. Ill try to remote.. Ill see what i can do
 
Dear Ridzuan,

Please clarify, how long do you think someone can stay in a trade to see a profitable amount using 0.01 or 0.02 as lot size.
How long do you always stay because I see you use 0.03 do you stay for days to have good profit using the manual system?
 
Dear Ridzuan,

Please clarify, how long do you think someone can stay in a trade to see a profitable amount using 0.01 or 0.02 as lot size.
How long do you always stay because I see you use 0.03 do you stay for days to have good profit using the manual system?

its depend on pair movement.when u r in market long enough, u able to know about the price movement. some pair's pace really fast while some are really slow. as for me..ill try to avoid CHF,AUD,NZD pair. the rest are ok.
 
issue solved. Good luck
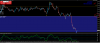
thanks alot ridzuan, but the charts zone values are showing different in windows 10 machine when i compare to chart running on windows 7 machine... and usdcad is in buy zone and in win 10 machine where u logged in, the fib level in buy zone is 100% then next one is 23.6% whereas in windows 7 machine the chart shows fib level 76.4% above the 100% level... i sent u a private msg with details... maybe u can see the same on ur chart too

i have attached image for u
 

Attachments

  • usdcad.png
    usdcad.png
    51.8 KB · Views: 198
Last edited:
its depend on pair movement.when u r in market long enough, u able to know about the price movement. some pair's pace really fast while some are really slow. as for me..ill try to avoid CHF,AUD,NZD pair. the rest are ok.


Thank you, these currencies has been giving me bad time with slow volatility. Am glad you listed them out, I'll avoid them.
 
thanks alot ridzuan, but the charts zone values are showing different in windows 10 machine when i compare to chart running on windows 7 machine... and usdcad is in buy zone and in win 10 machine where u logged in, the fib level in buy zone is 100% then next one is 23.6% whereas in windows 7 machine the chart shows fib level 76.4% above the 100% level... i sent u a private msg with details... maybe u can see the same on ur chart too

i have attached image for u

its actually the same. 23.6 and 76.4 is actually the same value.

100% - 23.6% = 76.4%
0 + 23.6% = 23.6%

its upside down. But the value is actually the same.
 
Back
Top