You are using an out of date browser. It may not display this or other websites correctly.
You should upgrade or use an alternative browser.
You should upgrade or use an alternative browser.
Suggestion I will make a Free EA with your Indicator
- Thread starter winidecorw
- Start date
Work on your idea well and I'll do it over the weekend, take a good look at this Thursday and Friday, take a good look at the details. I only program strategies or indicators that do not repaint, I will be attentive to your comments.Could you please put together EA buy /sell with Supertrend Plus , close positions with be-forex-guru-indicator, all custom settings (indicator's) available in EA, with martingale option as well.
I'm running it with Universal EA, can adjust settings of be-forex-gure-indicator, but can't do Supertrend Plus(no mq4).
Both indy's are rock solid.
thx!
thx, I am gonna try few other ideas, will let you know how it goes.Work on your idea well and I'll do it over the weekend, take a good look at this Thursday and Friday, take a good look at the details. I only program strategies or indicators that do not repaint, I will be attentive to your comments.
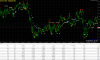
Here is another solid indy combined with flimsy one :
Attachments
It looks like Supertrend Plus is good for buy/sell, and Ultimate Pro indy for exit.Work on your idea well and I'll do it over the weekend, take a good look at this Thursday and Friday, take a good look at the details. I only program strategies or indicators that do not repaint, I will be attentive to your comments.
It's what you see , what you get.
Above SuperTrend arrows shows than plays hide and seek in front of my eyes.
Looking in Beast and Ultimate Pro to see which one gives better profit.
Ultimate is safe bet.
Attachments
Work on your idea well and I'll do it over the weekend, take a good look at this Thursday and Friday, take a good look at the details. I only program strategies or indicators that do not repaint, I will be attentive to your comments.
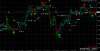
Some orders were taken by Universal Ea, that arrow indy above, removed it since , EURUSD I took myself with Supertrend Plus, they all look good initially, closed everything except EURUSD.
Will do with either Beast or Ultimate.
Live account .
Attachments
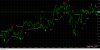
work in progress :
-with Beast loss would be 0.36 cents
-with Ultimate Pro Scalper 0.58 cents
-with Beast changed settings 0.18 cents profit at the time of snap shot, that might be the best option at the end ?
-with Beast loss would be 0.36 cents
-with Ultimate Pro Scalper 0.58 cents
-with Beast changed settings 0.18 cents profit at the time of snap shot, that might be the best option at the end ?
Attachments
need more time for real testing , testing and real testing don't produce same result's. It's time consuming to seat in front of the laptop and watch it .Work on your idea well and I'll do it over the weekend, take a good look at this Thursday and Friday, take a good look at the details. I only program strategies or indicators that do not repaint, I will be attentive to your comments.
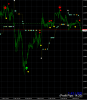
GBPUSD produced good result's on testing with Supertrend Plus and Super arrow.
Attachments
What do you want to do? A good system takes time to study. Also take this week and take a good look at when to go out, etc.need more time for real testing , testing and real testing don't produce same result's. It's time consuming to seat in front of the laptop and watch it .
GBPUSD produced good result's on testing with Supertrend Plus and Super arrow.
will doWhat do you want to do? A good system takes time to study. Also take this week and take a good look at when to go out, etc.
Shanthi Jeyachandran
New Member
- Credits
- 0
Auto hst file updater are available
donny hendarto
New Member
- Credits
- 0
Tanaka San,
Can u make ur EA Good Arrow Indicator (revC) Magic goes 2 Ways ? Buy And Sell, keep it No Marti, just need one open Opposite candle when the EA when wrong direction. so the DD will reduce and close all together then open new one as usual.
All for all of u guys looking for a great EA, this one is great EA thanks to Tanaka San.
Attachments
Cyril Nzimande
New Member
- Credits
- 0
Can you make hma arrows indicator to an ea. Thanks
xxIReaperS
New Member
- Credits
- 0
CAN ANY ONE PUT PUT THIS INTO AN EA PLEASE
BASED ON MOVING AVERAGE AND STOCH
- 5 Period Exponential Moving Average (closed)
- 15 Period Exponential Moving Average (closed)
- 50 Period Exponential Moving Average (closed)
- Stochastic indicator K=13 D=5 Smooth=5 (13,5,5) 80/20 Levels
There are only two, yet very important rules to follow when
trading this strategy.
Let’s take a look at some examples:
- The K% line on the stochastic indicator MUST be above the D% line when taking a BUY & the K% line MUST be below the D% line when taking a SELL. Refer to the picture above to see how your chart should look
- Both the 5 & 15 EMA MUST cross the 50 EMA going upwards to create a BUY signal OR downwards for a SELL
signal.

Stochastic Trend Trading
In this example, we can see the K% is above the D% (as shown by the bottom green arrow). We can also see the 5 & 15 EMAhave crossed the 50 EMA (as indicated by the upper green arrow). Once both the 5 & 15 EMA’s have crossed the 50 EMAgoing upwards, we would have taken a BUY.
Next example:

trend trading strategy
In this example, we can see the K% is below D% (as shown by the bottom red arrow). We can also see the 5 & 15 EMAhave crossed the 50 EMA (as indicated by the upper red arrow). Once both the 5 & 15 EMA’s have crossed the 50 EMA going
downwards we would have taken a SELL.
THANK YOU IN ADVANCE
did u find someone?
nickbelonk
New Member
- Credits
- 0
It is because of that if the order was closed then next order is placed in the same direction without waiting for next signal?
I have remove the code anyway. Please test.
Hi Mr. Tanaka,
i try to use ea bstrend(remove hedge). it good ea, but when this ea running why only open 6 positions (buy/sell) and waiting until TP. i use default setting from ea. my question how to make this ea open more than 6 positions and follow the trend? need your solution sir
donny hendarto
New Member
- Credits
- 0
Tanaka San,
Can u make ur EA Good Arrow Indicator (revC) Magic goes 2 Ways ? Buy And Sell, keep it No Marti, just need one open Opposite candle when the EA when wrong direction. so the DD will reduce and close all together then open new one as usual.
All for all of u guys looking for a great EA, this one is great EA thanks to Tanaka San.
Hi MR tanaka, can u send the MQ4 file of the EA Good Arrow Indicator Magic (revC)?
")
- Credits
- 0
This is my review for this thread:
MT4 Investor
Login : 2050253
Password : CR7EA
SRVEUR : Weltrade-live
MT4 Investor
Login : 2050253
Password : CR7EA
SRVEUR : Weltrade-live