Hi Sir, Please tell me which broker use this EA..Strategy Overview
XAUUSD H1
Date: 8/27/2017 9:00:52 PM
Table of Contents
Description
Logic
Strategy Properties
Indicator Slots
Statistic Information
Additional Statistics
Description
Forex Strategy Builder found several hundred ambiguous bars during the backtest of this strategy. Such a situation may lead to inaccurate backtest result. To improve the reliability of the backtest you can use two tools - "Intrabar Scanner" and "Method Comparator".
An “ambiguous bar” is a bar that contains more than one orders and the backtesting algorithm is not able to determine for certain what the exact sequence of order execution was within the bar. This usually happens when we have more than one active order within the bar range. In this case the program doesn’t know which order to execute first. The sequence of the order execution is of great importance for correct strategy testing.
Forex Strategy Builder can use different methods to interpolate (calculate) the price route inside an ambiguous bar. Of all the available methods, the "Optimistic" one usually shows the best result (with some exceptions) and the "Pessimistic" one – the worst result (with some exceptions too).
You can compare the different methods and see the mean balance line by using the "Method Comparator". We can confidently assume that the mean balance line is the nearest scenario to the real one.
To improve the backtest accuracy you can use the "Scanner". It loads all available intrabar data (for shorter time frames in the same market) and uses it to calculate a more realistic route of the price within each bar.
It is also possible to combine the effect of the Scanner and the Comparator by switching on the automatic scan mode (from the Testing – Automatic scan menu). You should load the intrabar data from the scanner window in order to complete the auto scanning.
Top
Logic
Opening (Entry Signal)
Open a new long position or add to an existing position or reduce a short position at the closing price of the previous bar when the following logic condition is satisfied:
Open a new short position or add to an existing position or reduce a long position at the closing price of the previous bar when the following logic condition is satisfied:
- Williams' Percent Range* (Simple, 48, 130) rises.
Closing (Exit Signal)
- Williams' Percent Range* (Simple, 48, 130) falls.
Close an existing long position at the end of the week when the following logic condition is satisfied:
Close an existing short position at the end of the week when the following logic condition is satisfied:
- the Gator Oscillator (Smoothed, Weighted, 20, 168, 80, 19, 16, 156) expands.
Handling of Additional Entry Signals**
- the Gator Oscillator (Smoothed, Weighted, 20, 168, 80, 19, 16, 156) expands.
Entry signal in the direction of the present position:
Entry signal in the opposite direction:
- Add to the position no matter if it is at a profit or loss. Do not exceed the maximum allowed number of lots to open.
Trading Size
- Reduce the present position. If its amount is lower than or equal to the specified reducing lots, close it.
Always trade a constant number of lots.
Protection
- Opening of a new position - 0.1 lots.
- Adding to a position - 0.1 lots. Do not open more than 20 lots.
- Reducing a position - 0.1 lots from the current position.
The strategy does not provide a permanent loss limitation.
The strategy does not use a Take Profit.
--------------
* Use the indicator value from the previous bar for all asterisk-marked indicators!
** The averaging rules apply to the entry signals only. Exit signals close a position. They cannot open, add or reduce one.
Top
Strategy Properties
Handling of Additional Entry Signals
Next same direction signal behavior - Adds to the position
Next opposite direction signal behavior - Reduces the position
Trading Size
Maximum number of open lots - 20
Number of entry lots for a new position - 0.1
In case of addition - number of lots to add - 0.1
In case of reduction - number of lots to close - 0.1
Protection
Stop Loss - None
Take Profit - None
Break Even - None
Top
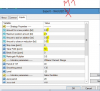
Indicator Slots
The slots show the logic for the long positions only. computes the proper logic for the short positions.
Strategy Properties
Same direction signal Add
Opposite direction signal Reduce
Stop Loss None
Take Profit None
Break Even None
Previous Bar Closing
Enter the market at the previous Bar Closing
Base price Previous Bar Closing
Williams' Percent Range
WPR rises
Smoothing method Simple
Period of %R 48
Smoothing period 130
Level -20
Use previous bar value Yes
Logical group A
Signal shift 0
Signal repeat 0
Indicator symbol Default
Indicator period Default
Week Closing
Exit the market at the end of the week
Base price Close
Gator Oscillator
The Gator Oscillator expands
Smoothing method Smoothed
Base price Weighted
Jaws period 20
Jaws shift 168
Teeth period 80
Teeth shift 19
Lips period 16
Lips shift 156
Use previous bar value No
Logical group a
Signal shift 0
Signal repeat 0
Indicator symbol Default
Indicator period Default
Top
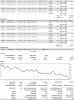
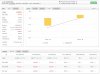
Statistic Information
Input Parameters Account Statistics
Profile name Default profile Acceptance criteria Fulfilled
Data source name Tickmill demo Net balance 171265.85 USD
Strategy name d1 eur Intrabar scanning Not accomplished
Chart XAUUSD H1 Ambiguous bars 0
Data bars 3766 Backtest quality 100.0000 %
Time of updating 2017-08-26 00:00 Profit per day 736.37 USD
Time of beginning 2017-01-06 05:00 Max consecutive losses 146
Spread 30.00 points System quality number 2.66
Swap long -2.00 points Sharpe ratio 0.08
Swap short -2.00 points Average HPR 0.26 %
Commission 0.00 points Profit factor 3.68
Slippage 0.00 points Tested bars 3576
Interpolation method Pessimistic Minimum balance 6281.63 USD
Initial Account 10000 USD Maximum balance 191374.91 USD
Leverage 500 Max balance drawdown 20109.06 USD
Account exchange rate Not used Max equity drawdown 38002.02 USD
Auto scan Switched off Max equity drawdown 61.42 %
Trade until Margin Call Switched on Max stagnation 70 days
Average profit 684.85 USD
Average loss -195.41 USD
Executed orders 3477
Win/loss ratio 0.51
Time in position 100%
Top
Additional Statistics
Parameter Long + Short Long Short
Initial account [USD] 10000.00 10000.00 10000.00
Account balance [USD] 171265.85 138045.13 43220.72
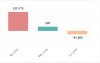
Net profit [USD] 161265.85 128045.13 33220.72
Net profit [%] 1612.66 1280.45 332.21
Gross profit [USD] 221549.45 145426.87 76122.57
Gross loss [USD] -60283.60 -17381.75 -42901.85
Profit factor 3.68 8.37 1.77
Annualized profit [USD] 254814.01 202322.39 52491.62
Annualized profit [%] 2548.14 2023.22 524.92
Minimum account [USD] 6281.63 9931.19 6281.63
Minimum account date 1/24/2017 1/30/2017 1/24/2017
Maximum account 191374.91 139258.08 63698.23
Maximum account date 8/3/2017 7/28/2017 5/9/2017
Absolute drawdown [USD] 3718.37 68.81 3718.37
Maximum drawdown [USD] 20109.06 10086.49 20477.50
Maximum drawdown [%] 61.42 8.14 32.15
Maximum drawdown date 1/6/2017 7/5/2017 8/25/2017
History bars 3766 3766 3766
Tested bars 3576 3576 3576
Bars with trades 1225 690 535
Bars with trades [%] 34.26 19.30 14.96
Number of trades 1264 709 555
Winning trades 647 492 155
Losing trades 617 217 400
Win/loss ratio 0.51 0.69 0.28
Maximum profit [USD] 41097.98 41097.98 21939.10
Average profit [USD] 342.43 295.58 491.11
Maximum loss [USD] -4005.01 -1035.60 -4005.01
Average loss [USD] -97.70 -80.10 -107.25
Expected payoff [USD] 127.58 180.60 59.86
Average HPR [%] 0.26 0.40 0.42
Geometric HPR [%] 0.22 0.37 0.26
Sharpe ratio 0.08 0.13 0.06
You are using an out of date browser. It may not display this or other websites correctly.
You should upgrade or use an alternative browser.
You should upgrade or use an alternative browser.
New EA XAUUSD H1 can not back test you have to test it on live demo account only let it run for 1-2-3
Bro, +109% in 2 months with dd 11%. Is it account reaper?This EA is account RAPER
Time to move on...
You use default settings ?Bro, +109% in 2 months with dd 11%. Is it account reaper?
Just changed the lot size...You use default settings ?
yes, account RAPERBro, +109% in 2 months with dd 11%. Is it account reaper?
Show your account details here +109% doesn't hold water. I also can say my account grew 700% in 3 months. But well, not true, innit?
https://www.mql5.com/ru/signals/575504#!tab=tab_accountyes, account RAPER
Show your account details here +109% doesn't hold water. I also can say my account grew 700% in 3 months. But well, not true, innit?
This is monitoring with this EA
This EA is account RAPER
Time to move on...
I agree, i stopped it a few weeks ago, not profitable on the long term. I had great results at the start on april (eurusd, gbpusd) but it crashed after .
May and June with XAUUSD only losses too, cent account, default settings, real account infortunately
Both demo and real are not profitable, this ea is very unpredictable.
Demo:

Attachments
Wellhttps://www.mql5.com/ru/signals/575504#!tab=tab_account
This is monitoring with this EA
For once, its not LIVE, demo LOL what?
I used GOLD only, per recommended by Vishal
To my mind, this EA is awesome !!
Finally something refreshing different.
Just play arround with a 1000-USD-DEMO and put it on a M1 chart XAUUSD to study the behaviour.
Why M1 ?
Because it´s quicker and makes more fun...
The TP is adjusting every new candle.
The EA just need enough capital to breathe...sooner or later it catches the trend ;-)
Just relax...let it run...and watch it...during last hour made +30USD with 60 trades...nice job")

Finally something refreshing different.
Just play arround with a 1000-USD-DEMO and put it on a M1 chart XAUUSD to study the behaviour.
Why M1 ?
Because it´s quicker and makes more fun...
The TP is adjusting every new candle.
The EA just need enough capital to breathe...sooner or later it catches the trend ;-)
Just relax...let it run...and watch it...during last hour made +30USD with 60 trades...nice job
Attachments
Last edited:
- Credits
- 13
not a stable ea. and not trustworthy
Agree... if you use the settings as advised in the first post:
Max equity drawdown 61.42 %
Trade until Margin Call Switched on
Max stagnation 70 days
...no thanks!
I have changed the settings to scalp with use of breakeven, stoploss and take profit.
I have had a 90%+ success rate this week, and I am increasing volume as it is proving successful!
Thanks for the EA. I will be sharing results shortly!
Definitely one of the best EA I have come across recently! Nice work!
To those that complain, you need to understand an EA is simply a tool. It is how you use it that matters. Many EA will work if you get the settings right.
- Credits
- 13

You could be correct at 65% win-rate. I had a winning streak, so I preemptively made the erroneous assumption it had a 90%+ accuracy. A losing streak since has proven this assumption incorrect.
I am running two instances simultaneously with different Alligators but both have the same results. I will soon try different William%R settings and I expect different results (as per logic).
Even at 65% win-rate, 100%+ per month is spectacular!
Thanks for sharing your backtest!
Logic
Open (Entry conditions):
Open a new long position or add to an existing position or reduce a short position at the closing price of the previous bar when the following logic condition is satisfied: Williams' Percent Range* (Simple, 48, 130) rises.
Open a new short position or add to an existing position or reduce a long position at the closing price of the previous bar when the following logic condition is satisfied: Williams' Percent Range* (Simple, 48, 130) falls.
Closing (Exit Signal):
Close an existing long position at the end of the week when the following logic condition is satisfied: the Gator Oscillator (Smoothed, Weighted, 20, 168, 80, 19, 16, 156) expands.
Close an existing short position at the end of the week when the following logic condition is satisfied: the Gator Oscillator (Smoothed, Weighted, 20, 168, 80, 19, 16, 156) expands.
Attachments

Last edited:
pls share set file . tnxAgree... if you use the settings as advised in the first post:
Max equity drawdown 61.42 %
Trade until Margin Call Switched on
Max stagnation 70 days
...no thanks!
I have changed the settings to scalp with use of breakeven, stoploss and take profit.
I have had a 90%+ success rate this week, and I am increasing volume as it is proving successful!
Thanks for the EA. I will be sharing results shortly!
Definitely one of the best EA I have come across recently! Nice work!
To those that complain, you need to understand an EA is simply a tool. It is how you use it that matters. Many EA will work if you get the settings right.
- Credits
- 0
what is your settings and timeframe ?View attachment 90146
You could be correct at 65% win-rate. I had a winning streak, so I preemptively made the erroneous assumption it had a 90%+ accuracy. A losing streak since has proven this assumption incorrect.
I am running two instances simultaneously with different Alligators but both have the same results. I will soon try different William%R settings and I expect different results (as per logic).
Even at 65% win-rate, 100%+ per month is spectacular!
Thanks for sharing your backtest!
- Credits
- 13

- Credits
- 0
your time frame is 1h ?I am still working to improve the settings, but I think there is "potential" if you get the settings right.
I have SL 3x distance of TP, with BreakEven. Need to increase success rate somehow...
View attachment 90391
- Credits
- 13
your time frame is 1h ?
I am using M30, but I wouldn't go below this timeframe. I have tried M5 and M1 and that was not a good idea.
Higher timeframe = more accurate signals (somewhat).
I hope you can try something better than what I have. Keep testing and we might get a really good setting!
- Credits
- 0
what about other pairs ?I am using M30, but I wouldn't go below this timeframe. I have tried M5 and M1 and that was not a good idea.
Higher timeframe = more accurate signals (somewhat).
I hope you can try something better than what I have. Keep testing and we might get a really good setting!
gbpusd or gbpjpy, do you think can work ?