- Credits
- 0
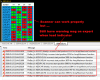
Something like this please. Crossed columns are not required. Dashboard just show list of pairs where RSI(3) divergence occurs in H1 or H4 or D1 or Weekly Timeframe.
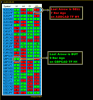
I am attaching a new indicator. This one might not bring buffer issues. Kindly see below indicator settings.

And thank you once again for your vital support.


")