I'll give some little explain about what is dashboard scanner
coz people still asking the same question on here or direct msg.
FIRST u need to know.. This EA is only a tool to help with manual trading..THIS IS NOT AUTO TRADING EA !!!
pls don't ask me again about that.
When we've a solid strategy and trade manual without EA, will make us tired ... If we want to monitor 28 pairs at a time, we have to open 28 charts on mt4 one for each pair and analyze them one by one.

spent a lot of time and once again make us bored and tired !!!
This kind of dashboard scanner will help u monitoring all pair with ur basic strategy ... u can saving a lot of time to atch the market.
i'll help to code ur rule as a dashboard scanner FOR FREE !!
Just put/post ur strategy and rule here.. don't send me private msg for request i'll not reply
all request should be drop in this thread, in order to other member can test it or use it
lets start with this short explain ...
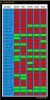
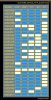
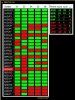
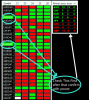
i'll use SCANNER_SOEHOE.ex4 on first page for sample so that it can be more easily understood.
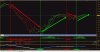
let say u have this strategy :
BUY when :
- Price above MA 50 and
- RSI Period 14 above 50
- Stochastic 5,3,3 Main Line above 50
- Parabolic SAR signal is UP/buy
- and ADX Period 14 +D1 above -D1
SELL when :
- Price below MA 50 and
- RSI Period 14 below 50
- Stochastic 5,3,3 Main Line below 50
- Parabolic SAR signal is DOWN/sell
- and ADX Period 14 +D1 below -D1
then i'll make dashboard scanner with all the rule ..
when its done the dashboard would be like SCANNER_SOEHOE.ex4
let assume we will check EURUSD and CADCHF for buy/sell possibility
pict like below :
 for this scanner work properly u must update all history pair data on mt4
open pair on chart start with M1 TimeFrame untill all candle fully load (if ur internet connection is good it only takes a few seconds).. when done the last candle time is current time, move to M5 candle and wait till all candle fully load to ... do it for all TimeFrame till MN. it will update all history data in ur MT4 terminal.
Hope u all understand what i talk about