ATTENTION POWERFUL TOOL!!!
This version works on the 28 best-known currency pairs ,I repeat only on currencies.
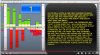
If you are here, it is because you are curious about performing the Forex tool.
The tool you on the real movement that Forex market, using real mathematical calculations based on the variation.
Because Forex is math.

This version works on the 28 best-known currency pairs ,I repeat only on currencies.
If you are here, it is because you are curious about performing the Forex tool.
The tool you on the real movement that Forex market, using real mathematical calculations based on the variation.
Because Forex is math.

")