You are using an out of date browser. It may not display this or other websites correctly.
You should upgrade or use an alternative browser.
You should upgrade or use an alternative browser.
My Scalping Trade
- Thread starter mutenext
- Start date


Hi Hemmy,I am not clear to me.Please Clear me.It has two lines.One is Horizontal and another is vertical.Which Line we can count 1st ? Vertical or Horizontal. Please clearify me.heatmap looks clear for me.. easy to find pair
Sometimes, Horizontal Line has 2/3 pairs are Read and sometimes Vertical lines has 2/3 Pairs are Blue.So which Line 1st Count ?

what was your SL and TPresult so far
View attachment 54914
how did you use it?? when red line cross yellow then open trade?
Hi Hemmy,I am not clear to me.Please Clear me.It has two lines.One is Horizontal and another is vertical.Which Line we can count 1st ? Vertical or Horizontal. Please clearify me.
Sometimes, Horizontal Line has 2/3 pairs are Read and sometimes Vertical lines has 2/3 Pairs are Blue.So which Line 1st Count ?
Either you watch vertical line or horizontal it doesnt matter.
Its easier if you just look HORIZONTAL line. If you see USD all GREEN on all or most pairs, that mean USD is good to BUY. RIGHT?
HORIZONTAL - GREEN -BUY USD
ok! So now we have GBPUSD and USDJPY, what do we do?
At the moment we are just considering USD beeing bullish but on the chart we will have to consider how GBP and JPY are.
So USD is Bullish. in the pair USDJPY we are buying the pair. We buy USD because its bullish, so WE BUY THE PAIR.
And, GBPUSD, what we do? USD is strong... If we buy GBPUSD we are buying GBP, so we are selling USD. But USD is strong so we must do the oposite... SELL GBP and BUY USD ---> SELL GBPUSD
Did you get it?
AAA - Green Horizontal (strong buy AAA) --> BUY AAAXXX; SELL XXXAAA
AAA - Red Horizontal (strong sell AAA) --> SELL AAAXXX; BUY XXXAAA
please read all previous post specially Dtrader post.. he explained it very clearlyHi Hemmy,I am not clear to me.Please Clear me.It has two lines.One is Horizontal and another is vertical.Which Line we can count 1st ? Vertical or Horizontal. Please clearify me.
Sometimes, Horizontal Line has 2/3 pairs are Read and sometimes Vertical lines has 2/3 Pairs are Blue.So which Line 1st Count ?
this is not as simple as it looks
have to judge following scanario
1. Currency pair ready to fire
2.already fired
3.Position of currency pair i mean it already touched weekly/monthly/daily support or resistance and try to break it.
if pair already fired and its just ready to rebound and we open a wrong trade it will kill all of our profit.
Attachments


Yes you are absolutely right here, because of pull backs,retracements, and reversals.There is need to confirm with other trading tools before entry.this is not as simple as it looks
have to judge following scanario
1. Currency pair ready to fire
2.already fired
3.Position of currency pair i mean it already touched weekly/monthly/daily support or resistance and try to break it.
if pair already fired and its just ready to rebound and we open a wrong trade it will kill all of our profit.
View attachment 54936
Do you use any indicator for entry?this is not as simple as it looks
have to judge following scanario
1. Currency pair ready to fire
2.already fired
3.Position of currency pair i mean it already touched weekly/monthly/daily support or resistance and try to break it.
if pair already fired and its just ready to rebound and we open a wrong trade it will kill all of our profit.
View attachment 54936
this is not as simple as it looks
have to judge following scanario
1. Currency pair ready to fire
2.already fired
3.Position of currency pair i mean it already touched weekly/monthly/daily support or resistance and try to break it.
if pair already fired and its just ready to rebound and we open a wrong trade it will kill all of our profit.
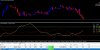
Lia, this is very very good observation. I already thought of it as i had a similar strategy using CCI which was giving same entrys as this. Problem was the suport/resistance. Those are very bad entry points as the market bouce back a lot of times. So i started using fxr_sr_zones3.10 indicator to show me exacta SR lines.
I´m at the process of building EA based on this strategy with a limitation of number of trades/hour and an exclusion from S/R Lines.
You spot the problem very well.. i was just a bit ahead
")
- Credits
- 0
True. You need S/R and something to indicate proper price action. I use GMMA to solve this problem.
@Dtrader,Thanks a lot for Clearify me.Excellent your Idea.Go Ahead.Allah Hafez.Either you watch vertical line or horizontal it doesnt matter.
Its easier if you just look HORIZONTAL line. If you see USD all GREEN on all or most pairs, that mean USD is good to BUY. RIGHT?
HORIZONTAL - GREEN -BUY USD
ok! So now we have GBPUSD and USDJPY, what do we do?
At the moment we are just considering USD beeing bullish but on the chart we will have to consider how GBP and JPY are.
So USD is Bullish. in the pair USDJPY we are buying the pair. We buy USD because its bullish, so WE BUY THE PAIR.
And, GBPUSD, what we do? USD is strong... If we buy GBPUSD we are buying GBP, so we are selling USD. But USD is strong so we must do the oposite... SELL GBP and BUY USD ---> SELL GBPUSD
Did you get it?
AAA - Green Horizontal (strong buy AAA) --> BUY AAAXXX; SELL XXXAAA
AAA - Red Horizontal (strong sell AAA) --> SELL AAAXXX; BUY XXXAAA
hi i just found these two indicator on forexfactory how is it?Do you use any indicator for entry?
Attachments
make simple system bro ...hi i just found these two indicator on forexfactory how is it?
dont use other indicator
this system is super simple
example :
EUR : Horizontal line GREEN = buy pair EURxxx
when to BUY ?
after bid ratio > +/- 0.45%
Last edited:
EUR : Horizontal line RED = SELL pair EURxxxEUR is red plz check it
when to SELL ?
after bid ratio > +/- 0.45%