FXOpen Trader
Member
- Credits
- 0
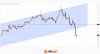
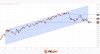
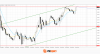
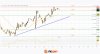
The American Currency Resumes Growth

The beginning of October turned out to be favourable for continued growth in the US dollar. From the data published yesterday, it follows that in September, the US manufacturing business activity index (PMI) rose to 49.0 against the forecast of 47.7. The ISM manufacturing employment index for the same period also turned out to be positive: 51.2 versus 48.3. Add to this the hawkish statements of the FOMC members who have spoken in recent days, and we can observe another upward impulse on the greenback.
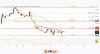
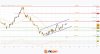
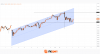
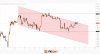
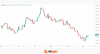
NZD/USD
For commodity currencies, the current week is extremely rich in important fundamentals. This morning, the Reserve Bank of Australia met, tomorrow, the RBNZ will announce its verdict on the rate, and on Friday, the US employment report will be released.
According to analysts' forecasts, the New Zealand regulator will leave the rate unchanged, which may put additional pressure on the NZD/USD pair. On the weekly timeframe, we are seeing a rebound from the important level of 0.6000. If the current situation does not change, we can expect a renewal of the March low of this year at 0.5860. We can consider cancelling the downward scenario only after a confident consolidation above 0.6050.

VIEW FULL ANALYSIS VISIT - FXOpen Blog...
Disclaimer: This article represents the opinion of the Companies operating under the FXOpen brand only. It is not to be construed as an offer, solicitation, or recommendation with respect to products and services provided by the Companies operating under the FXOpen brand, nor is it to be considered financial advice.
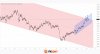
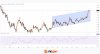
The beginning of October turned out to be favourable for continued growth in the US dollar. From the data published yesterday, it follows that in September, the US manufacturing business activity index (PMI) rose to 49.0 against the forecast of 47.7. The ISM manufacturing employment index for the same period also turned out to be positive: 51.2 versus 48.3. Add to this the hawkish statements of the FOMC members who have spoken in recent days, and we can observe another upward impulse on the greenback.
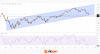
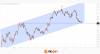
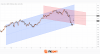
NZD/USD
For commodity currencies, the current week is extremely rich in important fundamentals. This morning, the Reserve Bank of Australia met, tomorrow, the RBNZ will announce its verdict on the rate, and on Friday, the US employment report will be released.
According to analysts' forecasts, the New Zealand regulator will leave the rate unchanged, which may put additional pressure on the NZD/USD pair. On the weekly timeframe, we are seeing a rebound from the important level of 0.6000. If the current situation does not change, we can expect a renewal of the March low of this year at 0.5860. We can consider cancelling the downward scenario only after a confident consolidation above 0.6050.
VIEW FULL ANALYSIS VISIT - FXOpen Blog...
Disclaimer: This article represents the opinion of the Companies operating under the FXOpen brand only. It is not to be construed as an offer, solicitation, or recommendation with respect to products and services provided by the Companies operating under the FXOpen brand, nor is it to be considered financial advice.