- Credits
- 0
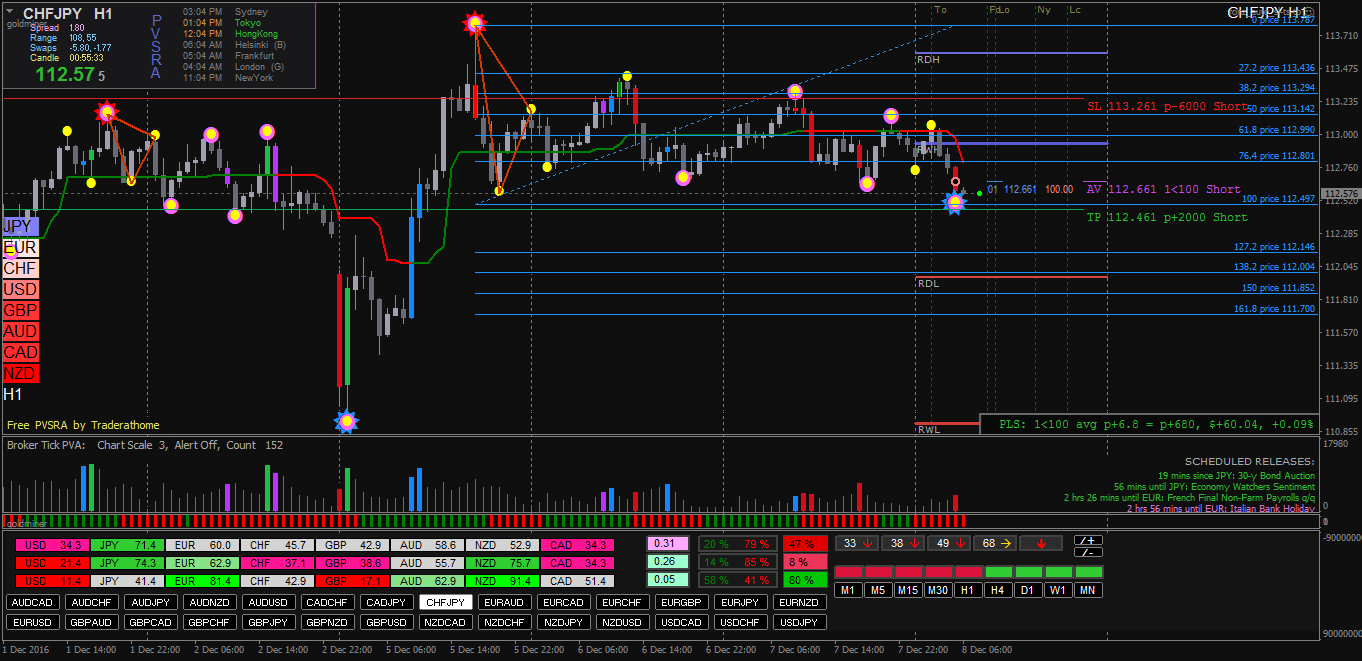
The Fibonacci indicator is one that is commonly used by institutional traders and therefore the level of support and resistance created by this indicator is more significant.
The Fibonacci indicator consists of retracement and extension. All you need to do is to drag the indicator from the top to the bottom of the wave and you will be able to select which retracement and extension level you want to show.
From my trading experience, retracement level like the 0.382, 0.500 and the 0.618 have more power than the rest of the retracement levels. As for the extension, it depends on the retracement.
If the price hits the 0.382 retracement level, the price will usually stop at the 1.272 extension level.

