• Welcome back! Thank you for being a part of this Traders Community. Let's discuss and share :)
    Selamat datang kembali! Trimakasih telah menjadi bagian dari Komunitas Trader ini. Mari berdiskusi dan berbagi :)

Suggestion My Trading Stratagy

kiokio

Member
Credit Hunter
Credits
0
Hello . I will send you my trading method. I am successful in 7 out of 10 transactions with this method. You can be successful with capital management continuously.
Let's go for my method:

1- The time form of work depends on you and your mood and the type of currency pair or...
2- Follow the gold time trade, that is, trade at the best time according to the type of trade. I work with gold and the Dow Jones index, so London and usa time are suitable for me.
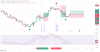
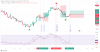
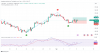
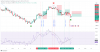
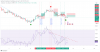
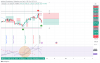
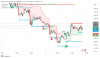
3- Always draw the RSI trend line chart and wait for two entry signals after the breakoutRSI .
4- Candle that caused the failure of the trend. It is the first signal
5- The second candle after the signal candle, if it goes one tick more or less in the direction of breaking the trend, you can enter.
6- The stop lost is the highest or the lowest point according to the RSI trend
7- profit one by one to the highest and lowest point.
8- based on stratagy i made a orders in 1,2,4 not 3 .
See attached file .
Good luck and comment
 

Attachments

  • XAUUSD_2023-09-08_12-35-57.png
    XAUUSD_2023-09-08_12-35-57.png
    139 KB · Views: 259
Signal 1 ,2,4 = 100 accorate .

Now corrent signal is number 5
 

Attachments

  • XAUUSD_2023-09-08_13-06-49.png
    XAUUSD_2023-09-08_13-06-49.png
    141.2 KB · Views: 206
  • XAUUSD_2023-09-08_13-06-49.png
    XAUUSD_2023-09-08_13-06-49.png
    141.2 KB · Views: 167
Rsi swing indicator . This indicator is updated during the trend.you can update the RSI trend you have drawn. Failure according to this indicator will be the most profitable entry (number 4 ). You have to work with this indicator for a while to understand exactly what I mean
 
upload_2023-9-11_15-36-25.png
Rsi swing indicator . This indicator is updated during the trend.you can update the RSI trend you have drawn. Failure according to this indicator will be the most profitable entry (number 4 ). You have to work with this indicator for a while to understand exactly what I mean

Thank you for sharing this, i want to try it out. Are my indicator setting correct?
 

Attachments

  • upload_2023-9-11_15-36-25.png
    upload_2023-9-11_15-36-25.png
    120.4 KB · Views: 434
Based on RSI SWING indicator , now i'm waiting for break out red RSI line to make buy order . See attached
 

Attachments

  • XAUUSD_2023-09-13_15-03-46.png
    XAUUSD_2023-09-13_15-03-46.png
    159 KB · Views: 118
Take profit !! Yess See attached ! Number 7 . I have told u on lasr post .
XAUUSD_2023-09-17_00-37-21.png
 

Attachments

  • XAUUSD_2023-09-17_00-37-21.png
    XAUUSD_2023-09-17_00-37-21.png
    156.9 KB · Views: 381
Hello All ,

Based on my strategy ,I have to wait to find RSI trend to draw RSI trend . XAUUSD_2023-09-18_00-49-19.png
 

Attachments

  • XAUUSD_2023-09-18_00-49-19.png
    XAUUSD_2023-09-18_00-49-19.png
    128.3 KB · Views: 366
Hi

SN 8 = SL
SN 9 = in profit till Now

SUM = 5 position take profit / 2 stop lost / 1 no action / 1 Open position

XAUUSD_2023-09-21_19-43-17.png
 

Attachments

  • XAUUSD_2023-09-21_19-43-17.png
    XAUUSD_2023-09-21_19-43-17.png
    113.8 KB · Views: 345
3 new sucsesful order . TP9 is risky as 4tf IS DOWN TRADE .
 

Attachments

  • XAUUSD_2023-10-03_16-23-08.png
    XAUUSD_2023-10-03_16-23-08.png
    78.4 KB · Views: 110
Thank you for sharing your trading method! It’s clear that you’ve developed a strategy with a focus on timing, trend analysis, and risk management. Drawing the RSI trend line and waiting for breakouts, combined with careful entry signals and using stop loss at key levels, makes a lot of sense for managing risk. I would suggest reviewing the market conditions regularly to ensure your setup still applies. Good luck, and thanks again for sharing your approach!
 
Back
Top