Teknik DTM fokus pada 3 dimensi
Pertama-tama kita menentukan arah dari pair yang akan ditradingkan berdasarkan penutupan candle terakhir. referensinya adalah warna candle heiken ashi kemarin (daily)
jika warna candle heiken ashi ditutup biru, maka hari ini kita trading long
Entry Level
Pindahkan ke timeframe H1 tentukan trend di dalam direction hari itu
Trend = 8SMA Channel berada benar-benar di atas/di bawah garis 20SMA
kita trading sesuai dengan direction hari ini apabila channel 8SMA berada di atas/di bawah garis 20SMA dan candle heiken ashi H1 ditutup di atas/di bawah channel 8SMA
Jika kondisi itu terpenuhi, maka kita trading selama candle 1 jam terakhir ditutup dengan warna yang sesuai dengan direction yang kita analisis di awal.
Jika candle harian memberikan direction, tapi chart H1 tidak menunjukkan trend dengan jelas (channel 8SMA tidak benar-benar di atas/di bawah garis 20SMA) maka hari ini tidak ada trade!
Jika setelah trade pertama selesai (kena TP) dan market masih mendukung untuk masuk lagi, kita open posisi lagi apabila market bergerak dibawah 2/3 dari ATR(14) daily. Jika market telah bergerak melebihi 2/3 dari ATR (14) daily dalam sehari, maka tidak membuka posisi baru!
Exit Level
Untuk menentukan TP/SL berdasarkan ATR(14) timeframe daily. Dengan cara membagi 3 angka ATR(14) daily.
Contoh: jika ATR(14) daily GU menunjukkan angka 0.01225 = 122,5 pips maka target kita adalah 40,8 pips
Contoh: jika ATR(14) daily UJ menunjukkan angka 1.404 = 140,4 pips maka target kita adalah 46,8 pips
itu semua berlaku untuk TP dan SL
Contoh Penggunaan Teknik
Pair: GBPJPY
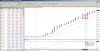
Lihat Gambar Step1
Penentuan direction: candle terakhir biru maka posisi long
ATR(14)Daily: 0.02069
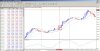
Lihat Step 2
Channel 8SMA (warna hitam) di atas garis 20SMA (warna lightblue) candle terakhir heiken ashi biru (KONFIRMASI) open posisi BUY!
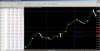
Lihat Step 3
Tentukan TP/SL dengan dasar ATR
Penutup
Demikian yang bisa saya sharing, jika ada pertanyaan lebih lanjut silahkan PM saya. credit to : Mr Avramis Depostis yang menemukan teknik ini.
ENGLISH VERSION
DTM Technique Focus on 3 dimensions:
1. Direction
2. Trend
3. Momentum
Indicator used:
1. Heiken Ashi on Daily timeframe and H1 (With no shadows on candles)
2. ATR(14) on Daily timeframe
3. 20 Simple moving average on H1 timeframe
4. 8 Simple moving average (Applied on High and Low) on H1 timeframe
Direction
First we determine the direction we would like to trade based on the last closed candle. Looking at yesterdays closed candle, depending on the color of - Daily candle of heiken ashi
e.g if yesterdays candle closed red on heiken ashi, we are only interested in trading short for today.
Entering
Go to the H1 chart and search for a trend in the direction of the daily:
Trend means the 8SMA channel is completely above or completely below the 20SMA.
We only Trade the Daily direction if the 8SMA channel is above/below the 20SMA in our direction AND heiken ashi candle has closed above/below 8SMA channel.
if above conditions are met, we only take the long/short trade as long as last H1 candle closes with heiken ashi color in our direction
Notes: if we have Daily candle giving us direction, but on the H1 we don't have clear trend (i.e 8SMA not completely above/below 20SMA- upper and lower boundaries) then we DO NOT have a trade for the day with this instrument.
Notes: After the first trade is finished, if the market continues to give a signal to next trade, we only take a new trade if the market has travelled less than the 2/3 of ATR(14)(Daily)
if market has travelled a distance more than 2/3 of the ATR on specific trading day, WE DO NOT TAKE ON NEW TRADES.
Exit Level
We determine our exit level based on the ATR(14) of the daily timeframe.
We divide the ATR(14)(Daily) by 3 and this gives us the distance we will place our TP/SL
e.g if ATR(14) IS 0.0100 then we set our TP/SL to 0.0033 in either direction. 1 SL and 1 TP level.
The Applications Example
GBPJPY
1. We look at last daily heiken ashi candle: Blue candle means we only trade LONG
2. We go to H1 from the start of the trading day- we have 8SMA high low (Black lines) completely above the 20SMA (light blue line)- we have a clear entry signal.
3. After a heiken ashi candle closes blue (H1), after the close of the candle (above channel) since moving average are aligned we enter our long trade.
4. We look at the ATR(14)(Daily) = 0.02069 (206,9 pips)
5. ATR/3 = 68.9 pips
6.Set TP/SL 68,9 pips from our entry level.
- Direction (Arah)
- Trend
- Momentum
- Heiken Ashi timeframe daily & H1 tanpa shadows
- Average True Range (14) pada chart daily
- Simple moving Average 20 pada timeframe H1
- Simple moving Average 8 pada timeframe H1 (applied on high & low)
Pertama-tama kita menentukan arah dari pair yang akan ditradingkan berdasarkan penutupan candle terakhir. referensinya adalah warna candle heiken ashi kemarin (daily)
jika warna candle heiken ashi ditutup biru, maka hari ini kita trading long
Entry Level
Pindahkan ke timeframe H1 tentukan trend di dalam direction hari itu
Trend = 8SMA Channel berada benar-benar di atas/di bawah garis 20SMA
kita trading sesuai dengan direction hari ini apabila channel 8SMA berada di atas/di bawah garis 20SMA dan candle heiken ashi H1 ditutup di atas/di bawah channel 8SMA
Jika kondisi itu terpenuhi, maka kita trading selama candle 1 jam terakhir ditutup dengan warna yang sesuai dengan direction yang kita analisis di awal.
Jika candle harian memberikan direction, tapi chart H1 tidak menunjukkan trend dengan jelas (channel 8SMA tidak benar-benar di atas/di bawah garis 20SMA) maka hari ini tidak ada trade!
Jika setelah trade pertama selesai (kena TP) dan market masih mendukung untuk masuk lagi, kita open posisi lagi apabila market bergerak dibawah 2/3 dari ATR(14) daily. Jika market telah bergerak melebihi 2/3 dari ATR (14) daily dalam sehari, maka tidak membuka posisi baru!
Exit Level
Untuk menentukan TP/SL berdasarkan ATR(14) timeframe daily. Dengan cara membagi 3 angka ATR(14) daily.
Contoh: jika ATR(14) daily GU menunjukkan angka 0.01225 = 122,5 pips maka target kita adalah 40,8 pips
Contoh: jika ATR(14) daily UJ menunjukkan angka 1.404 = 140,4 pips maka target kita adalah 46,8 pips
itu semua berlaku untuk TP dan SL
Contoh Penggunaan Teknik
Pair: GBPJPY
Lihat Gambar Step1
Penentuan direction: candle terakhir biru maka posisi long
ATR(14)Daily: 0.02069
Lihat Step 2
Channel 8SMA (warna hitam) di atas garis 20SMA (warna lightblue) candle terakhir heiken ashi biru (KONFIRMASI) open posisi BUY!
Lihat Step 3
Tentukan TP/SL dengan dasar ATR
Penutup
Demikian yang bisa saya sharing, jika ada pertanyaan lebih lanjut silahkan PM saya. credit to : Mr Avramis Depostis yang menemukan teknik ini.
ENGLISH VERSION
DTM Technique Focus on 3 dimensions:
1. Direction
2. Trend
3. Momentum
Indicator used:
1. Heiken Ashi on Daily timeframe and H1 (With no shadows on candles)
2. ATR(14) on Daily timeframe
3. 20 Simple moving average on H1 timeframe
4. 8 Simple moving average (Applied on High and Low) on H1 timeframe
Direction
First we determine the direction we would like to trade based on the last closed candle. Looking at yesterdays closed candle, depending on the color of - Daily candle of heiken ashi
e.g if yesterdays candle closed red on heiken ashi, we are only interested in trading short for today.
Entering
Go to the H1 chart and search for a trend in the direction of the daily:
Trend means the 8SMA channel is completely above or completely below the 20SMA.
We only Trade the Daily direction if the 8SMA channel is above/below the 20SMA in our direction AND heiken ashi candle has closed above/below 8SMA channel.
if above conditions are met, we only take the long/short trade as long as last H1 candle closes with heiken ashi color in our direction
Notes: if we have Daily candle giving us direction, but on the H1 we don't have clear trend (i.e 8SMA not completely above/below 20SMA- upper and lower boundaries) then we DO NOT have a trade for the day with this instrument.
Notes: After the first trade is finished, if the market continues to give a signal to next trade, we only take a new trade if the market has travelled less than the 2/3 of ATR(14)(Daily)
if market has travelled a distance more than 2/3 of the ATR on specific trading day, WE DO NOT TAKE ON NEW TRADES.
Exit Level
We determine our exit level based on the ATR(14) of the daily timeframe.
We divide the ATR(14)(Daily) by 3 and this gives us the distance we will place our TP/SL
e.g if ATR(14) IS 0.0100 then we set our TP/SL to 0.0033 in either direction. 1 SL and 1 TP level.
The Applications Example
GBPJPY
1. We look at last daily heiken ashi candle: Blue candle means we only trade LONG
2. We go to H1 from the start of the trading day- we have 8SMA high low (Black lines) completely above the 20SMA (light blue line)- we have a clear entry signal.
3. After a heiken ashi candle closes blue (H1), after the close of the candle (above channel) since moving average are aligned we enter our long trade.
4. We look at the ATR(14)(Daily) = 0.02069 (206,9 pips)
5. ATR/3 = 68.9 pips
6.Set TP/SL 68,9 pips from our entry level.
Attachments
Last edited:
