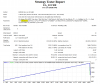
Hello estevambr. See below a BT with modeling 99,90%, for the first nine months of 2017 considering EUR/USD + Timeframe M1.
Regarding the parameters, I had to turnoff the multiplier. The first BT with the multiplier on (DbLots=1) simply blown the account at the beggining of the test. So the BT presented is based in a fixed lot of 0.01 and the parameter DbLots=2.
In my vision, this "Grid-Averaging" Style EA is configured with very agressive parameters.
For me it was a surprise that the EA survived the first nine months of 2017, but I atribute this to the use of fixed lot and also the restriction of a Maximum of 20 levels. The result of this kind of configuration in real life is that after a period of strong trend (as happened to the EUR-USD from May/2017 on), the EA stay working with a very high level of negative floating waiting a long time for an eventual reversion (if a crash doesn´t happen at this meantime). It should be interesting to you to run the EA on the Strategy tester in visual mode to watch this situation.
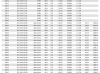
PS: The significative decrease of the balance at the final of the graph is due to the "close at stop" of the operations that were active at the end of the BT period. (I attached a screen showing this effect).
View attachment 34548 View attachment 34549


")