Dear
tanaka akiko
One last request from my side.
If my previous indicator is repainting, then could you please make an EA of below-mentioned indicator?
Indicator:
Download the 'AW Turtles Indicator MT5' Technical Indicator for MetaTrader 5 in MetaTrader Market (mql5.com)
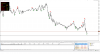
The indicator works according to the Turtle system and classically assumes a time interval of 20 and 55 candles. The trend is monitored at a given time interval. The entry is carried out at the moment of the breakdown of the support or resistance level. Exit signal - price breakout in the opposite direction of the trend of the same time interval.
Benefits:
- Tools: Currency pairs , stocks, commodities, indices, cryptocurrencies
- Timeframe: Classically D1, also suitable for working with any timeframe
- Trading time: around the clock
- Money management strategy: Risk per transaction no more than 1%
- When using additional orders, the risk for each additional position is 0.25%
Login rules:
1) Shorter term entry:
An entry condition is a breakout of the 20-day high or low.
The deal is skipped if the previous signal was successful.
Note! If the previous trade was closed with a profit, we skip the entry. If it suddenly turns out that the breakout is profitable, then later we enter it after breaking through the 55-day channel.
When the price breaks this channel, we enter the trade.
2) Longer term entry (if the 20-day breakout was missed for the reasons stated above):
The price breaks the 55-day high or low of the Donchian Channel.
Note! Approach 2 does not use the filter for the previous trade, we always enter.
Exit Strategies:
Stop Loss
1) In the classic version, there is a simplified form of calculation for turtles. It looks like this:
In order to work with the formula for calculating the stop loss, you should add the ATR indicator to the chart:
StopLoss = ATR (20) * 2
2) We offer an additional option for calculating StopLoss. This is an exit along the middle line of the indicator.
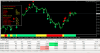
The screenshot in the product description shows both StopLoss options:
At the bottom, the ATR indicator with a period of 20 is displayed. Thus, in the first calculation, the Stop Loss will be 389 * 2 = 780 points.
In the upper part of the screenshot you can see the estimated Stoploss level for the second strategy, that is, along the middle line. The second option is Stoploss = 745 points.
As you can see, the StopLoss levels in the first and second cases are different, but have similar indicators. You can use any of the presented options in your trading.
Additional orders:
Installed at a distance of at least every 0.5 ATR from the entry point.
Input settings:
Period Donchian - Channel period. Based on the previous specified number of candles, from the low to the high price level. On channel breakouts, we receive signals of a trend reversal.
Maximum bars for calculation - The number of bars to calculate the indicator
NOTIFICATIONS SETTINGS
Send Push Notifications - Use notifications of new signals to the mobile version of the trader's terminal
Send PopUp Alerts - Use pop-up notifications
Send Email - Use sending letters about the appearance of signals to the trader's email
GRAPHICS SETTINGS
Multitimeframe dashboard - Panel view, minimized or full
Font size in panel - The size of the text on the indicator panel
Y offset - moving multi-timeframe Y-axis panels
X offset - moving the multi-frame panel along the X axis
Color Sell Line - Color of the upper line of the indicator
Color Buy Line - Color of the lower line of the indicator
Color Average Line - Color of the middle line of the indicator
Uptrend Color Panel - Color of the upward direction in the panel
Downtrend Color Panel - Color of the downward direction in the panel
Up Color Main Panel - Color uptrend in the panel
Down Color Main Panel - Downtrend color in the panel


DATA HERE


")